

As the market has priced in a higher risk of a recession, Canadian bank stocks have declined ~20% in just 5 months, including a ~10% decline since the sector started reporting Q3 results in late August. The market is worried that central banks will cause a recession as they aggressively raise interest rates to tame inflation. Further complicating their job is that central banks are simultaneously engaged in unprecedented quantitative tightening, which is placing upward pressure on rates. Interestingly, virtually all the decline in Canadian bank share prices can be attributed to falling price-to-earnings (“P/E”) multiples versus declining earnings estimates (which have remained stable). At the beginning of 2022, the group traded at ~11.1x current (f2022), and 10.5x forward (f2023); fast forward three quarters and, on average, they now trade at very depressed ~9.0x current (f2023) and ~8.5x forward (f2024)[1], suggesting the market is worried. In this insight, we will discuss the Canadian banks’ Q3 results and try to address whether investors should be (more) worried.
Before we discuss the banks, we would like to highlight the Hamilton Enhanced Canadian Financials ETF (ticker: HFIN), which invests in the top 12 Canadian financials by market capitalization and is the sister-ETF to the Hamilton Enhanced Canadian Bank ETF (ticker: HCAL). With large allocations to both banks and insurers (and Brookfield Asset Management), HFIN is an attractive option for investors looking for more diversified exposure to the Canadian financial sector and provides exposure to: (i) rising long-end of the yield curve, (ii) varied international platforms, and (iii) lower valuations. The current yield of HFIN is 6.91%[2], paid monthly. Both HCAL and HFIN utilize modest leverage of 25% to enhance the yield and growth potential for investors.
We would also like to announce the launch of the Hamilton Enhanced Utilities ETF (ticker: HUTS), which begins trading on Tuesday, September 6th. Providing exposure to 12 of Canada’s largest utility, pipeline, and telecommunications companies[3], HUTS offers investors one-stop exposure to these historically defensive industries with stable dividends and returns. HUTS is designed to provide higher monthly income and returns by utilizing modest leverage of 25%, and we believe is a superior alternative to utilities covered call ETFs (attractive yield without limiting the possible upside). HUTS has a target yield of 5.00%, with monthly distributions. For more information about HUTS, visit www.hamiltonetfs.com/etfs/huts and our recent post, “Get More from Canadian Utilities”.
Back to the banks.
Despite the market reaction, the quarter was surprisingly uneventful, with the greatest variability coming from seasonally weak capital markets and the absence of reserve releases on performing loans (a non-cash item). Importantly, as we discuss below, all major credit metrics improved. That said, the market remains focused on a potential economic slowdown that could lead to lower revenue/volume growth, weaker business activity and/or rising loan losses. Moreover, it does not seem to be discounting the potential for higher rates to support rising net interest margins and net interest income – the biggest source of revenues for the Canadian banks. The key trends impacting the quarter were as follows:
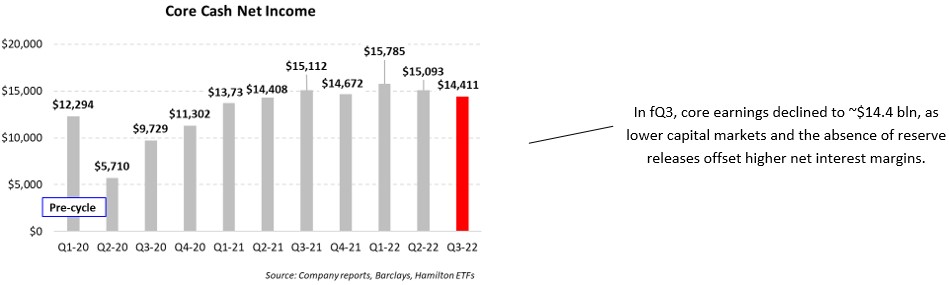
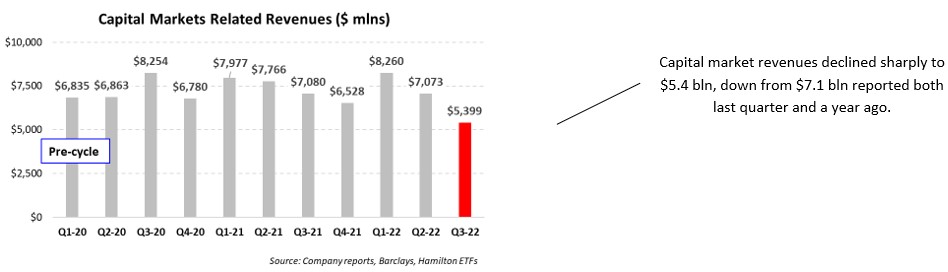
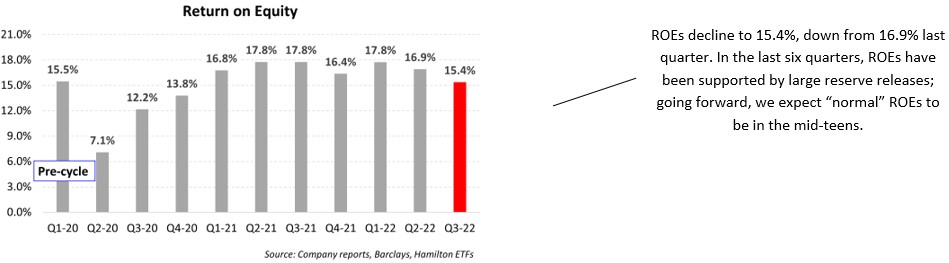
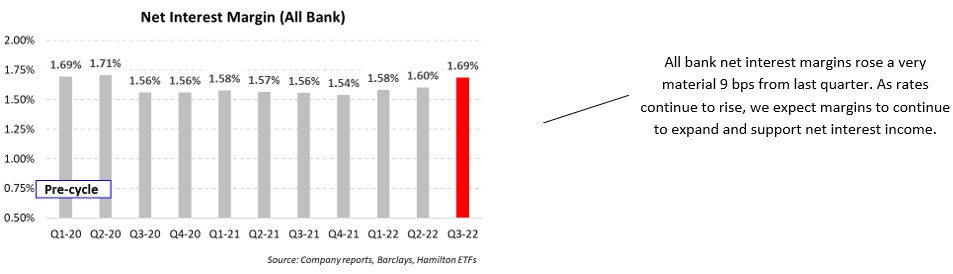
First, for fQ3, core cash earnings remained notably higher than pre-cycle at $14.4 bln, albeit lower than more recent quarters including last quarter’s $15.1 bln [see chart A]. This relatively high level of earnings was achieved despite a large decline in market sensitive revenues to ~$5.4 bln, from ~$7.1 bln last quarter [see chart B]. While the market is accustomed to the volatility of these businesses, this was much lower than expected. Nevertheless, ROEs remained solid at 15.4% [see chart C]. And on the positive side, all-bank net interest margins increased a notable 9 bps to 1.69% [see chart D], a trend we expect to see continue into next year.
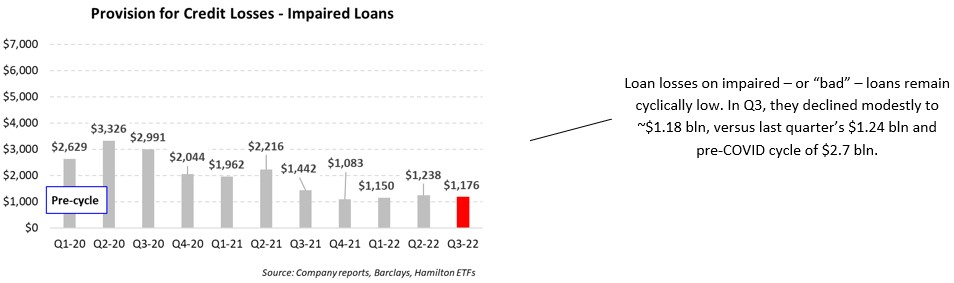
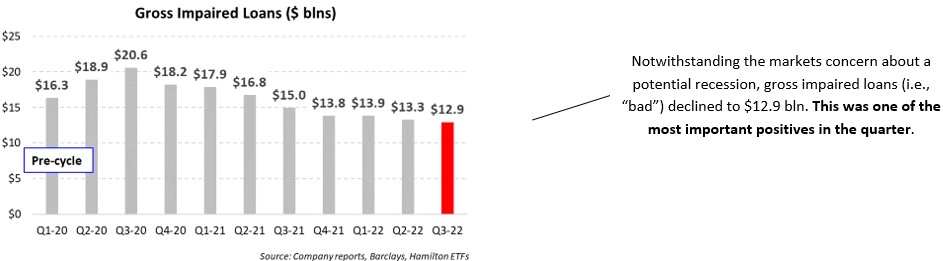
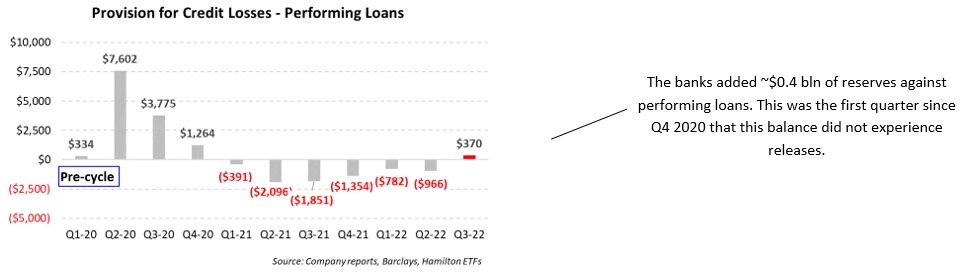
Second, and crucially, credit metrics relating to impaired – or “bad” – loans were positive. Provisions for credit losses for impaired (or “bad”) loans declined modestly, on a sequential basis, to ~$1.18 bln [see chart E] while gross impaired loans declined to $12.9 bln, from $13.3 bln last quarter [see chart F]. For the first time in 6 quarters, the banks did not release reserves against performing loans (i.e., loans still current in interest and principal – i.e., “good”).[4] This quarter the banks added to this accounting reserve, booking provisions against performing loans of a modest ~$370 mln [see chart G]. In fact, the entire sequential decline in core earnings can be attributed to the absence of non-cash reserve releases (after-tax).
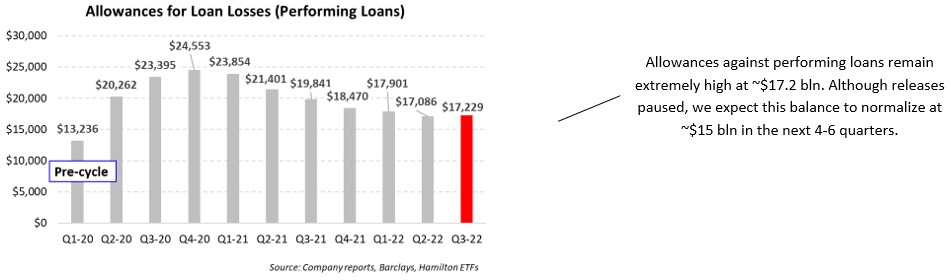
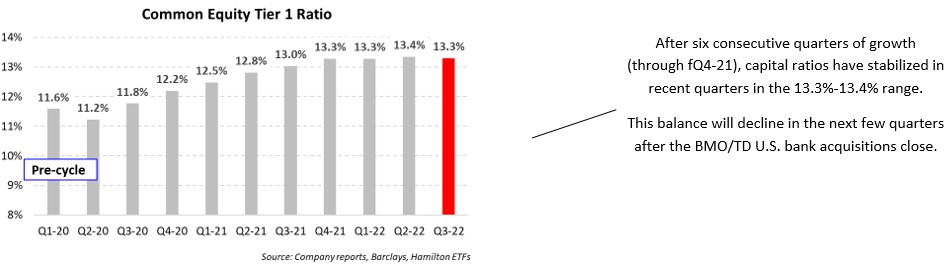
Third, balance sheet strength continues to be very strong. Allowances against performing loans remain large at over $17 bln [see chart H]. In our view, this is the most important “recession” insurance, since this allowance is still $4 bln higher than it was before the COVID downturn began. In the absence of a recession, we believe performing allowances ultimately normalize at ~$15 bln in the next 4-6 quarters. That said, even though trends in gross impaired loans are positive, it is unlikely the banks release reserves further until some of the economic uncertainty recedes. Capital levels were also very robust with CET1 ratios at over 13%, although this balance will decline somewhat once TD and BMO complete their sizeable, announced acquisitions [see chart I].
Valuations suggest the market is very worried.
So, should investors be more worried?
No … at least not yet.
Highly Depressed Canadian Bank Valuations Already Reflect a Lot of Worry
In our view, there was nothing directly related to the recent Canadian bank results that should be cause for alarm, especially given unemployment is still low. Earnings are not far from all-time highs, ROEs are in the mid-teens, and balance sheets are very strong, including/especially $17 bln of performing allowances. In the coming quarters, we expect the following three drivers to have the greatest influence on earnings/share prices: (i) the direction (recovery?) of capital markets (currently depressed in our view); (ii) net interest income, expected to benefit from higher NIMs, and/or; (iii) the potential for sluggish volume growth and/or higher loan losses on impaired loans should the economy falter.
This quarter provided no reasons for investor anxiety to rise. We believe the biggest source of comfort for investors should be that the market is already very worried as evidenced by very depressed P/E valuations of ~9.0x current and ~8.5x forward. These multiples would imply that the market is pricing in analyst estimates falling by 15-20% in the next few quarters. While possible, this would not appear to be a high probability outcome.
Investors seeking exposure to Canadian banks and insurers should consider the Hamilton Enhanced Canadian Financials ETF (HFIN), which offers the potential for higher long-term returns and a higher yield (6.91%[5], paid monthly). Investors seeking exposure to purely the Canadian banks should consider our top performing Canadian bank ETF[6], the Hamilton Enhanced Canadian Bank ETF (HCAL) or the Hamilton Canadian Bank Mean Reversion Index ETF (HCA), which offer attractive yields of 7.21% and 5.33%, respectively (paid monthly)5.
fQ3 2022 in Charts – Should Investors be (More) Worried?
A.
B.
C.
D.
E.
F.
G.
H.
I.
Recent Insights
Canadian Banks: TD Buys FHN – A Very Strong Fit | May 16, 2022
Canadian Banks: BMO’s High Risk, High(er) Reward Acquisition of BoW | January 27, 2022
HCA/HCAL Lead All Canadian Bank ETFs in 2021 | January 26, 2022
HFT – “Blue Chip” fintech ETF with Peer Leading Absolute and Risk-Adjusted Returns | December 22, 2021
Canadian Banks: Five Possible Drivers in 2022 (Q4 2021 in Charts) | December 17, 2021
Canadian Banks: How High Can Dividends Go? (and HCAL Outperforms) | October 19, 2021
____
A word on trading liquidity for ETFs …
Hamilton ETFs are highly liquid ETFs that can be purchased and sold easily. ETFs are as liquid as their underlying holdings and the underlying holdings trade millions of shares each day.
How does that work? When ETF investors are buying (or selling) in the market, they may transact with another ETF investor or a market maker for the ETF. At all times, even if daily volume appears low, there is a market maker – typically a large bank-owned investment dealer – willing to fill the other side of the ETF order (at net asset value plus a spread). The market maker then subscribes to create or redeem units in the ETF from the ETF manager (e.g., Hamilton ETFs), who purchases or sells the underlying holdings for the ETF.
[1] As of August 31, 2022
[2] As of September 1, 2022.
[3] To achieve its investment objective, HUTS will invest 1.25x its net asset value in the Horizons Utilities Services High Dividend Index ETF (ticker UTIL), which rebates back its entire management fee to HUTS.
[4] In the preceding 1.5 years, the banks released over $7 bln of reserves including ~$1 bln last quarter (Q2).
[5] As of September 1, 2022.
[6] Since inception, as at August 31, 2022. Based on a universe of seven Canadian bank ETFs that trade on the Toronto Stock Exchange.