

The objective of our ETFs, HDIV and HYLD, is to provide “attractive monthly income”. To accomplish this, we aim to create higher income ETF versions of the S&P/TSX 60 and S&P 500, respectively. Given the sector mix of the S&P/TSX 60 and the S&P 500 are highly complementary, and the two equity markets have related but different drivers, we believe there are benefits to holding a 50/50 portfolio of HDIV and HYLD. The performance of a 50/50 portfolio supports this stance (see “HDIV and HYLD – Performance Update; (Still) Working Well Together)” from April 10, 2023).
Since last summer[1], we have made changes to the holdings of HDIV and HYLD to support the yield/distributions, increase correlations to each country’s benchmark index, and lower combined fees. In this insight, we discuss the most recent changes to the HYLD portfolio. In addition, we discuss our decision to adjust HYLD’s per unit distribution to reflect the recent declines in JEPI and JEPQ’s distributions, as well as the cumulative declines in the distributions of the Global X ETFs since HYLD was launched.
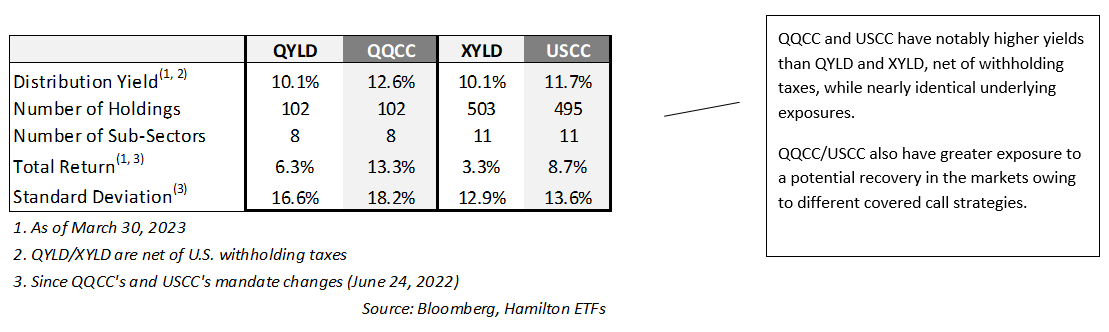
Adding QQCC, USCC / Reducing QYLD, RYLD, XYLD – Higher (Net) Yields, Greater Exposure to a Recovery (from Lower Coverage)
As we explained in our most recent performance update, HYLD has trailed the Vanguard S&P 500 Index ETF (CAD-Hedged) (VSP) since inception by ~2.9%[2], primarily from modest leverage in a down market, and the impact of withholding taxes (which are recoverable for taxable investors). The impact of withholding taxes is particularly relevant because of: (i) the very high distribution yields of the original Global X ETFs (QYLD/XYLD/RYLD); and (ii) the addition of the JPMorgan ETFs (JEPI and JEPQ), which increased the percentage of distributions from higher yielding U.S.-based ETFs.
We recently shifted material exposure to QQCC/USCC from QYLD/RYLD/XYLD which we believe offers the following benefits to HYLD. First, as shown in the table below, QQCC and USCC have materially higher yields (~2.5% and ~1.6%, respectively), net of withholding taxes. Second, the funds added (QQCC vs. QYLD; and USCC vs. XYLD) have nearly identical underlying exposures but lower coverage ratios (~50%), which should provide greater upside participation in a market recovery[3]. We believe this will be beneficial to long-term investors, as the market has corrected materially since HYLD’s launch in February 2022[4]. Third, going forward, this shift in covered call strategies should also make the underlying distributions of HYLD less sensitive to changes in volatility should the macro environment improve[5].
Change in HYLD’s Distribution – Tracking Recent Distribution Changes of JEPI/JEPQ, Cumulative Change in Global X Holdings
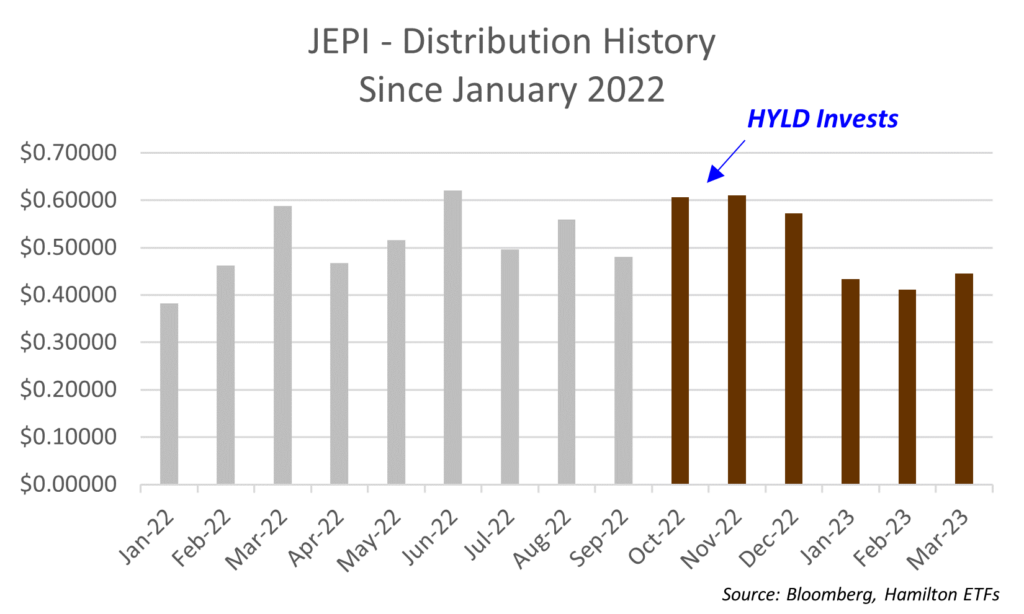
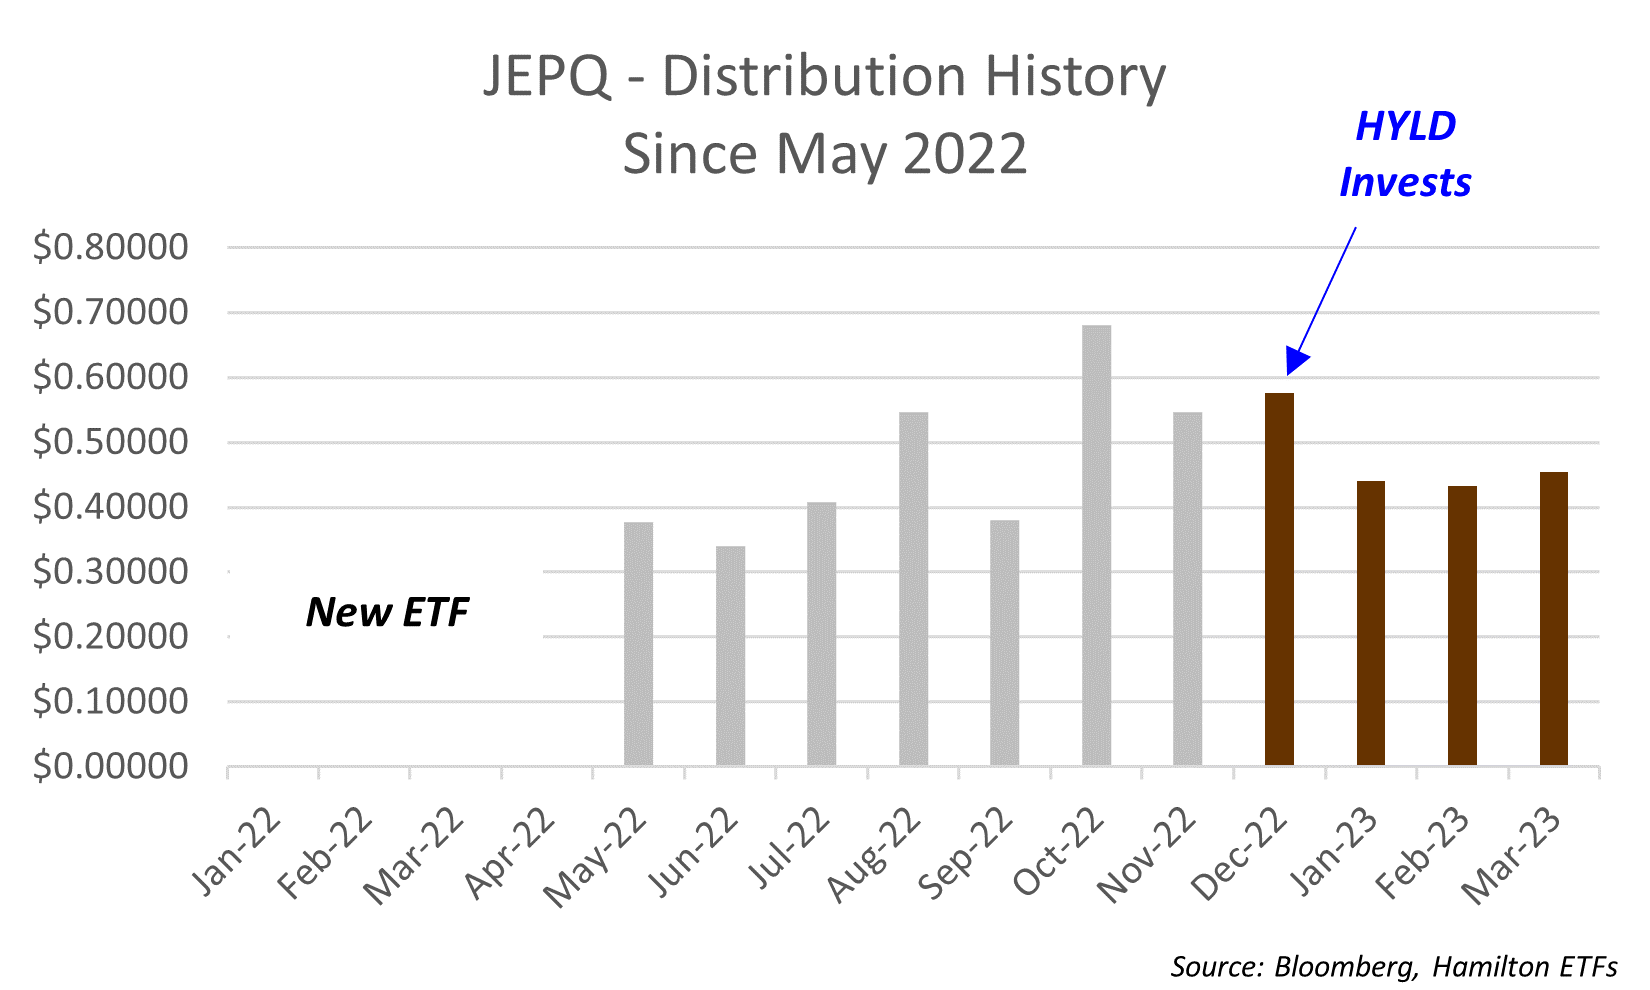
Since last fall, we have made several changes to HYLD’s holdings, the most consequential having been the addition of JEPI and JEPQ, which benefited HYLD by: (i) more closely aligning its sector mix to that of the S&P 500, thus increasing correlations, (ii) lowering all-in fees, and (iii) increasing distribution yields at the time. We explained the rationale for these changes in two separate Insights[6]. However, while JEPI/JEPQ and the Global X funds (QYLD/XYLD/RYLD) have very high yields, these five ETFs also have variable monthly distributions (see Appendix for distribution history).
How do we manage this variability for investors in HYLD?
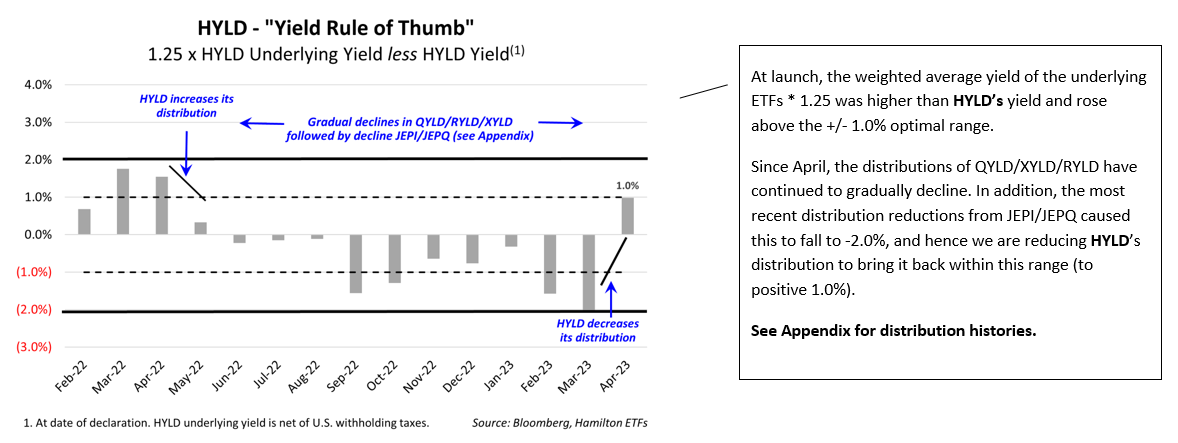
Since we launched HDIV and HYLD, we have stated that over the long-term, the yield will be roughly equal to the weighted average yield of the holdings, multiplied by 1.25 (to account for the modest leverage)[7]. In our application of this “rule of thumb”, we generally expect this range to be within +/-1.0%. However, if this “rule of thumb” falls outside of the more material +/-2.0% range – either above or below – we review for a change in the per unit distribution. The benefits of this approach are that it: (i) reduces the variability of distributions, and (ii) helps ensure that distributions are sustainable over the long-term.
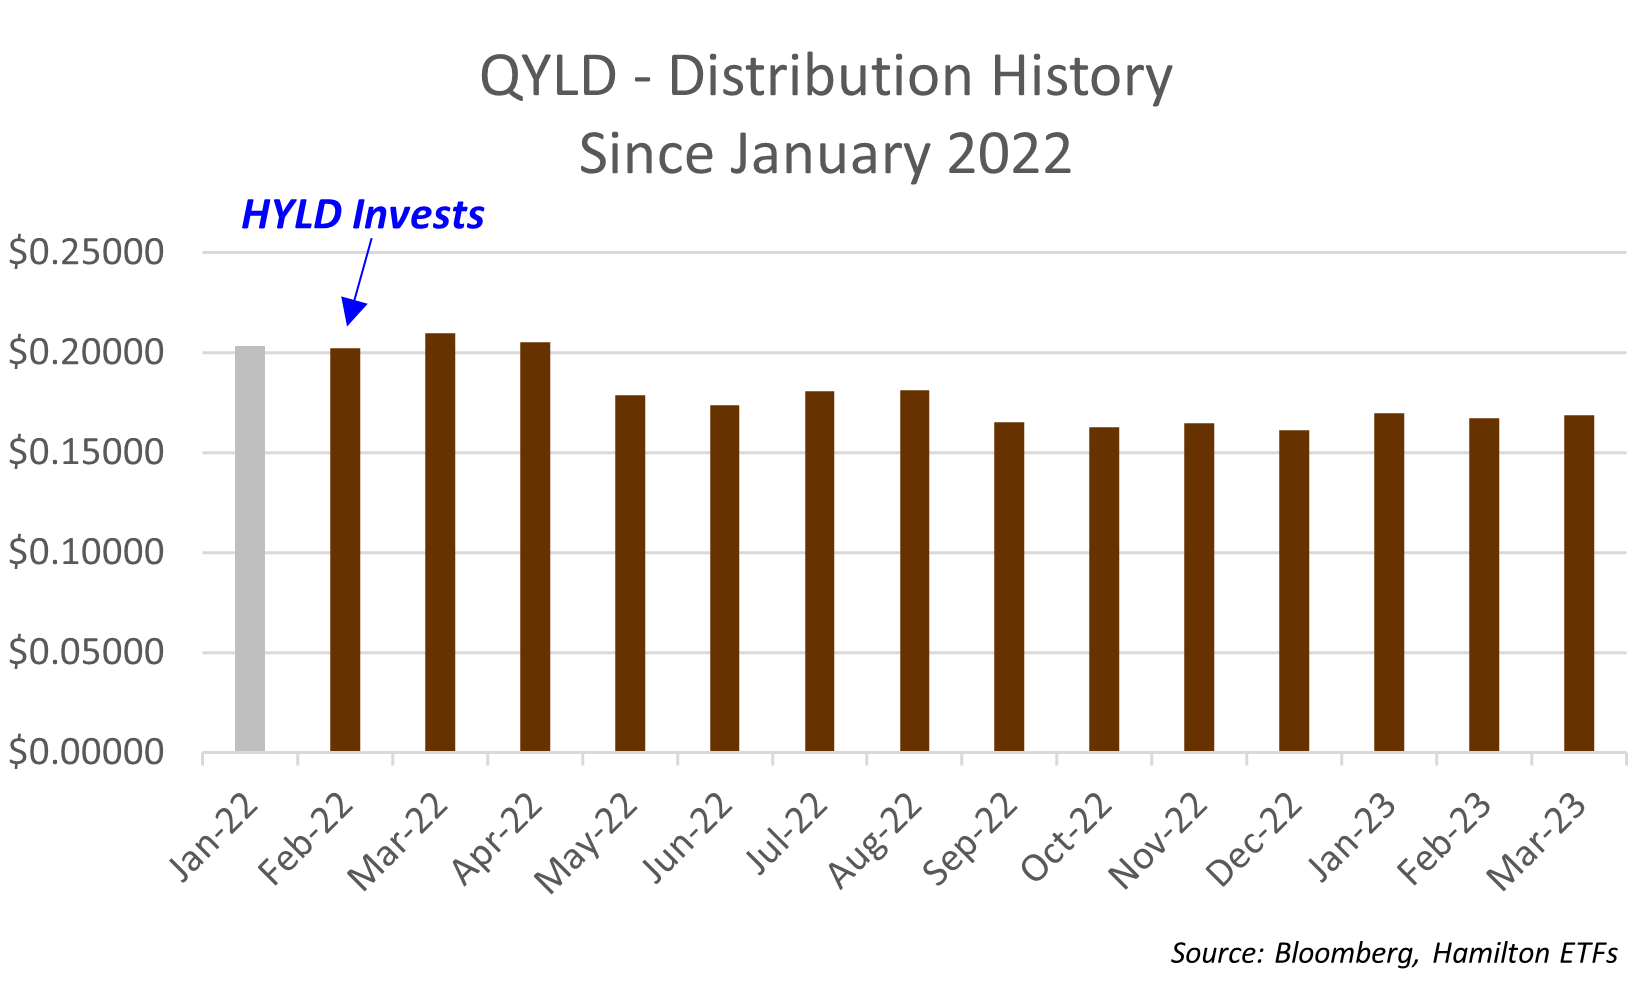
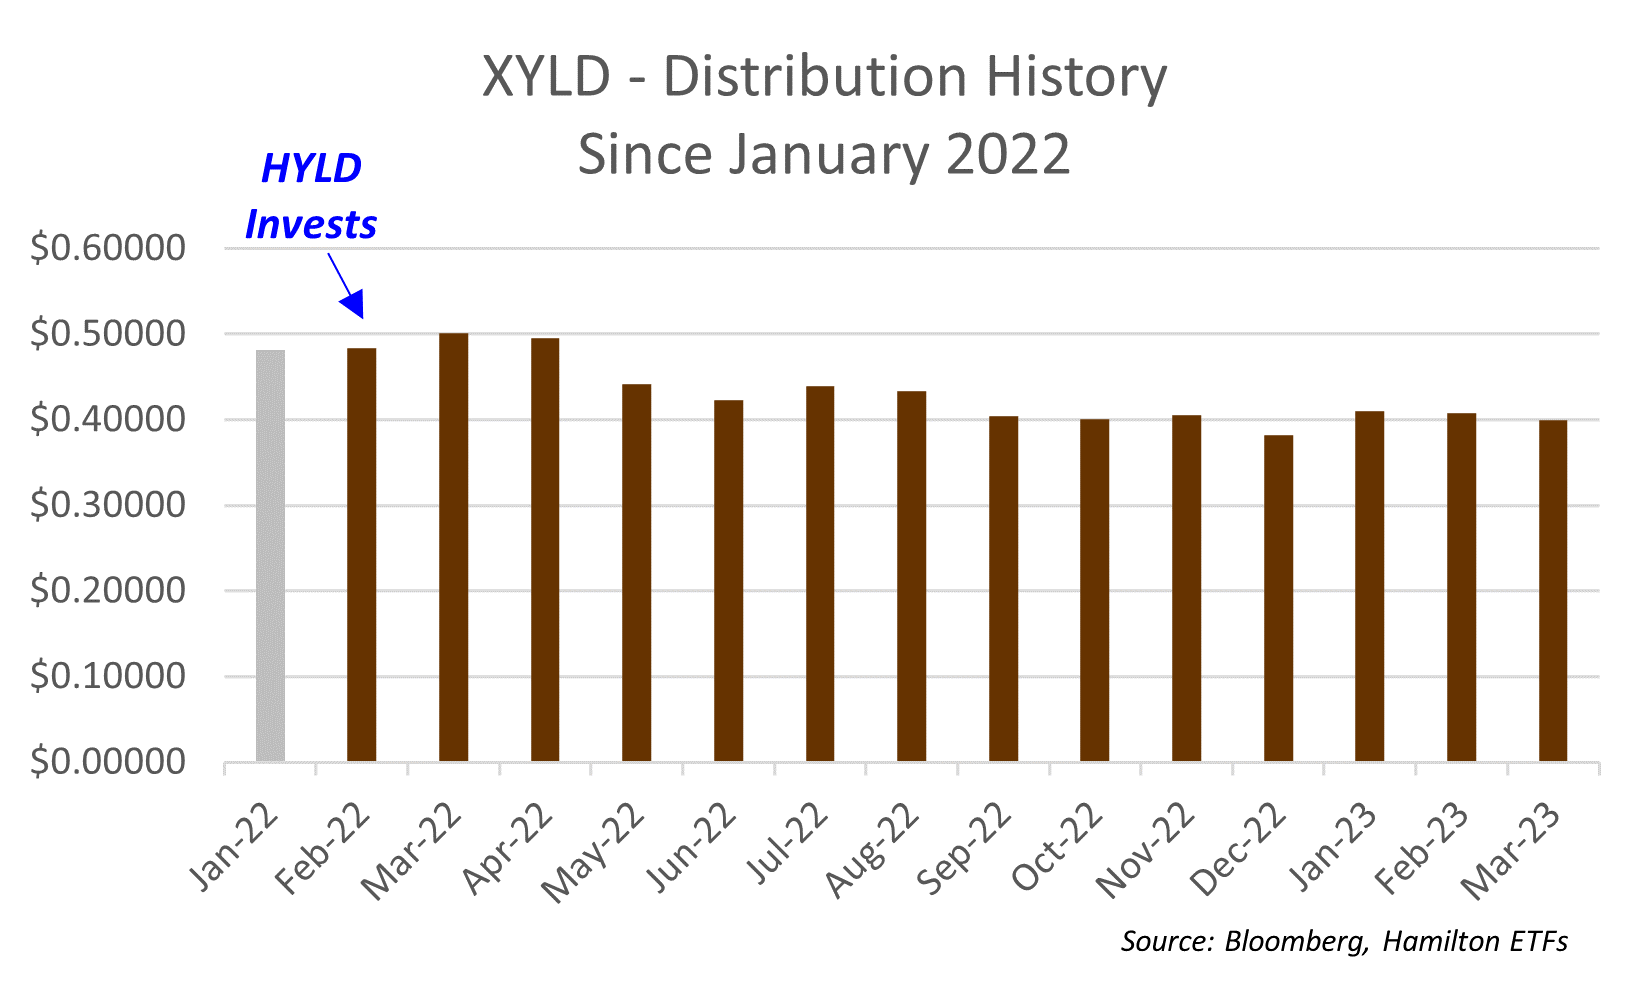
As you can see from the charts below, we have adhered closely to setting HYLD’s distributions to this “rule of thumb”. For conservatism, when HYLD launched in February 2022, the weighted average yield of the underlying ETFs * 1.25 was within the optimal range (+/- 1.0%) and rose to nearly 2.0% in the following month. After raising HYLD’s distribution to $0.14 per units (from $0.1375) in April 2022, the Global X ETFs began to gradually lower their distributions (see Appendix), reducing this cushion. Subsequently, it remained roughly within the band of +/-1.0% which allowed us to maintain the distribution at $0.14 per share.
However, shortly after HYLD added JEPI/JEPQ, both reduced their distributions notably (see Appendix), causing our “rule of thumb” measure to fall to the lower bound of -2.0%. To account for the lower level of underlying distributions, we have reduced the distribution of HYLD from $0.14 to $0.12, which translates to a still very attractive yield of 11.73%[8]. This distribution also brings the “rule of thumb” to within the optimal range at +1.0%.
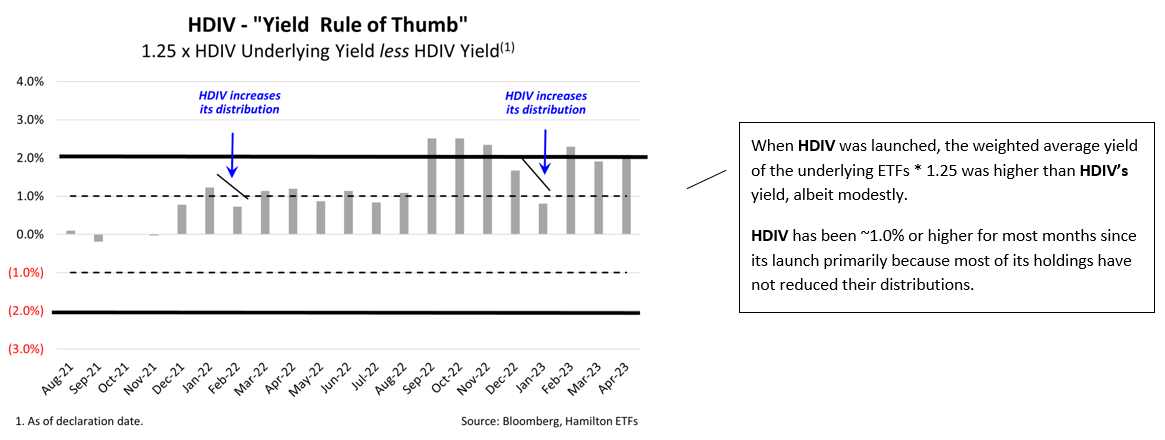
For the Hamilton Enhanced Multi-Sector Covered Call ETF (HDIV), we apply the same “rule of thumb”. As the chart below highlights, since HDIV was launched, the weighted average yield of its underlying holdings * 1.25 has been higher than HDIV’s yield almost every single month. Since inception, HDIV’s distribution has been increased twice and is currently $0.135/unit for a yield of 9.96%[9], and it has outperformed the iShares S&P/TSX 60 Index ETF (XIU) by a highly material 7.4% (total return including dividends)[10].
HDIV/HYLD – Continuing to Work Well Together
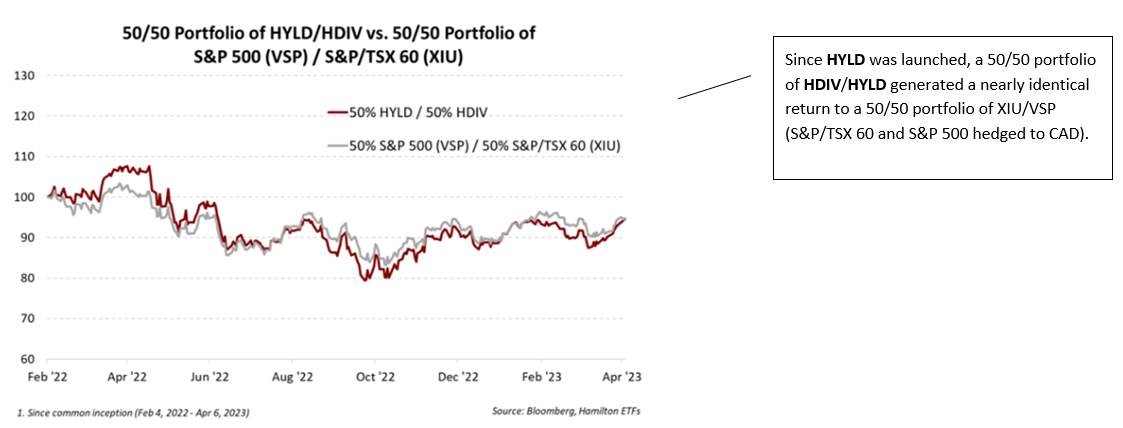
We continue to believe holding HDIV and HYLD together is an attractive way to gain exposure to the large Canadian and U.S. benchmark indices for investors seeking higher monthly income. As the chart below highlights, a 50/50 portfolio of HDIV/HYLD has produced a nearly identical return to a 50/50 portfolio of exposure to iShares S&P/TSX 60 Index ETF, XIU and VSP (CAD-hedged) while maintaining very high correlations.
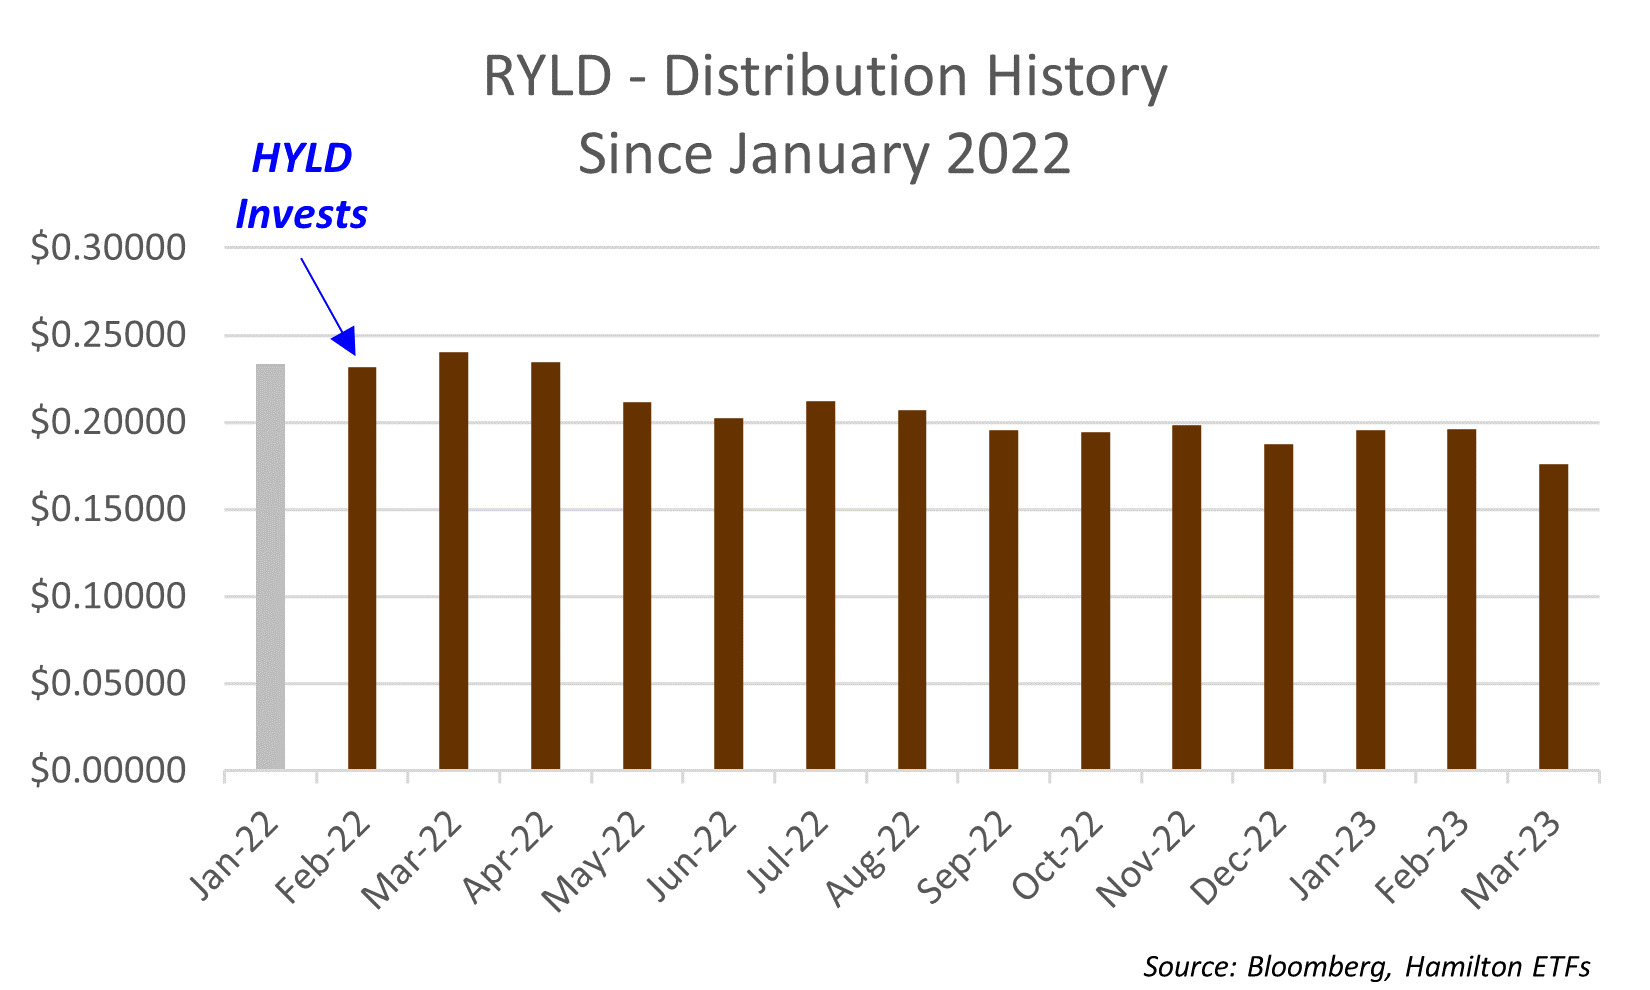
Appendix: Distributions of JEPI, JEPQ, QYLD, XYLD and RYLD
____
A word on trading liquidity for ETFs …
Hamilton ETFs are highly liquid ETFs that can be purchased and sold easily. ETFs are as liquid as their underlying holdings and the underlying holdings trade millions of shares each day.
How does that work? When ETF investors are buying (or selling) in the market, they may transact with another ETF investor or a market maker for the ETF. At all times, even if daily volume appears low, there is a market maker – typically a large bank-owned investment dealer – willing to fill the other side of the ETF order (at the bid/ask spread).
Commissions, management fees and expenses all may be associated with an investment in the ETFs. The relevant prospectus contains important detailed information about each ETF. Please read the relevant prospectus before investing. The ETFs are not guaranteed, their values change frequently and past performance may not be repeated.
Certain statements contained in this insight constitute forward-looking information within the meaning of Canadian securities laws. Forward-looking information may relate to a future outlook and anticipated distributions, events or results and may include statements regarding future financial performance. In some cases, forward-looking information can be identified by terms such as “may”, “will”, “should”, “expect”, “anticipate”, “believe”, “intend” or other similar expressions concerning matters that are not historical facts. Actual results may vary from such forward-looking information. Hamilton ETFs undertakes no obligation to update publicly or otherwise revise any forward-looking statement whether as a result of new information, future events or other such factors which affect this information, except as required by law.
[1] Prior to July 1, 2022, HDIV and HYLD each tracked a Solactive index.
[2] As of April 6, 2023. Source: Hamilton ETFs, Bloomberg
[3] The manager of QYLD/XYLD/RYLD writes options on 100% of the portfolio at-the-money but caps the distribution at 1% per month, which is sometimes less than half of the premiums received. The benefit of this strategy is it offers investors high yields and low beta. The downside is that since coverage is 100%, it caps investor upside in rising markets. For QQCC/USCC, the manager writes on ~50% of the portfolio, also at-the-money, but distributes all of the premiums received, which is often similar/greater than QYLD/XYLD/RYLD distributions. This is how QQCC/USCC can offer similar/higher distributions with greater upside participation.
[4] HYLD also reduced its exposure to the Horizons Gold Producer Equity Covered Call ETF (GLCC) to increase correlations to the S&P 500.
[5] As QQCC and USCC have the flexibility to adjust their coverage ratios
[6] See “HYLD – Adding JEPI, Selling HBF for Higher Yield, Added Diversification, Lower Fees” (October 2022), and “HYLD – Adding JEPQ, Selling TXF for Higher Yield, Added Diversification, Lower Fees” (January 2023)
[7] This includes management fees and expenses of the underlying holdings, but does not include HDIV/HYLD management fees, or expenses, including financing costs.
[8] As a percentage of HYLD’s net asset value as of April 18, 2023.
[9] As a percentage of HDIV’s net asset value as of April 18, 2023.
[10] Since inception. As at April 20, 2023