
Hamilton U.S. Financials
YIELD MAXIMIZER™
ETF
Higher Income from U.S. Financials

HIGHLIGHTS
Last Distribution of $0.1605*Last distribution per unit. Distributions are subject to change. For a complete list of historical distributions, please see the Distributions tab below.; monthly distributions
Exposure to the largest financial services companies in the U.S.
Active covered call strategy managed by an experienced options team led by Nick Piquard, with 25+ years of experience specializing in options
A GOOD FIT FOR INVESTORS WHO WANT
Attractive monthly income
Tax efficient distributions
Modest long-term growth potential
Reduced volatility from options strategy
INVESTMENT OBJECTIVE
FMAX is designed to deliver attractive monthly income while providing exposure to an equal-weight portfolio of U.S. financial services companies. To reduce volatility and augment dividend income, FMAX will employ an active covered call strategy.
FMAX does not use leverage.
Performance
- TICKER FMAX
- NAV $16.90
- 1 DAY CHANGE -$0.08
-
LAST DISTRIBUTION *
Last distribution per unit. Distributions are subject to change. For a complete list of historical distributions, please see the Distributions tab below.
$0.1605 - ASSETS $53.4M
Higher Monthly Income
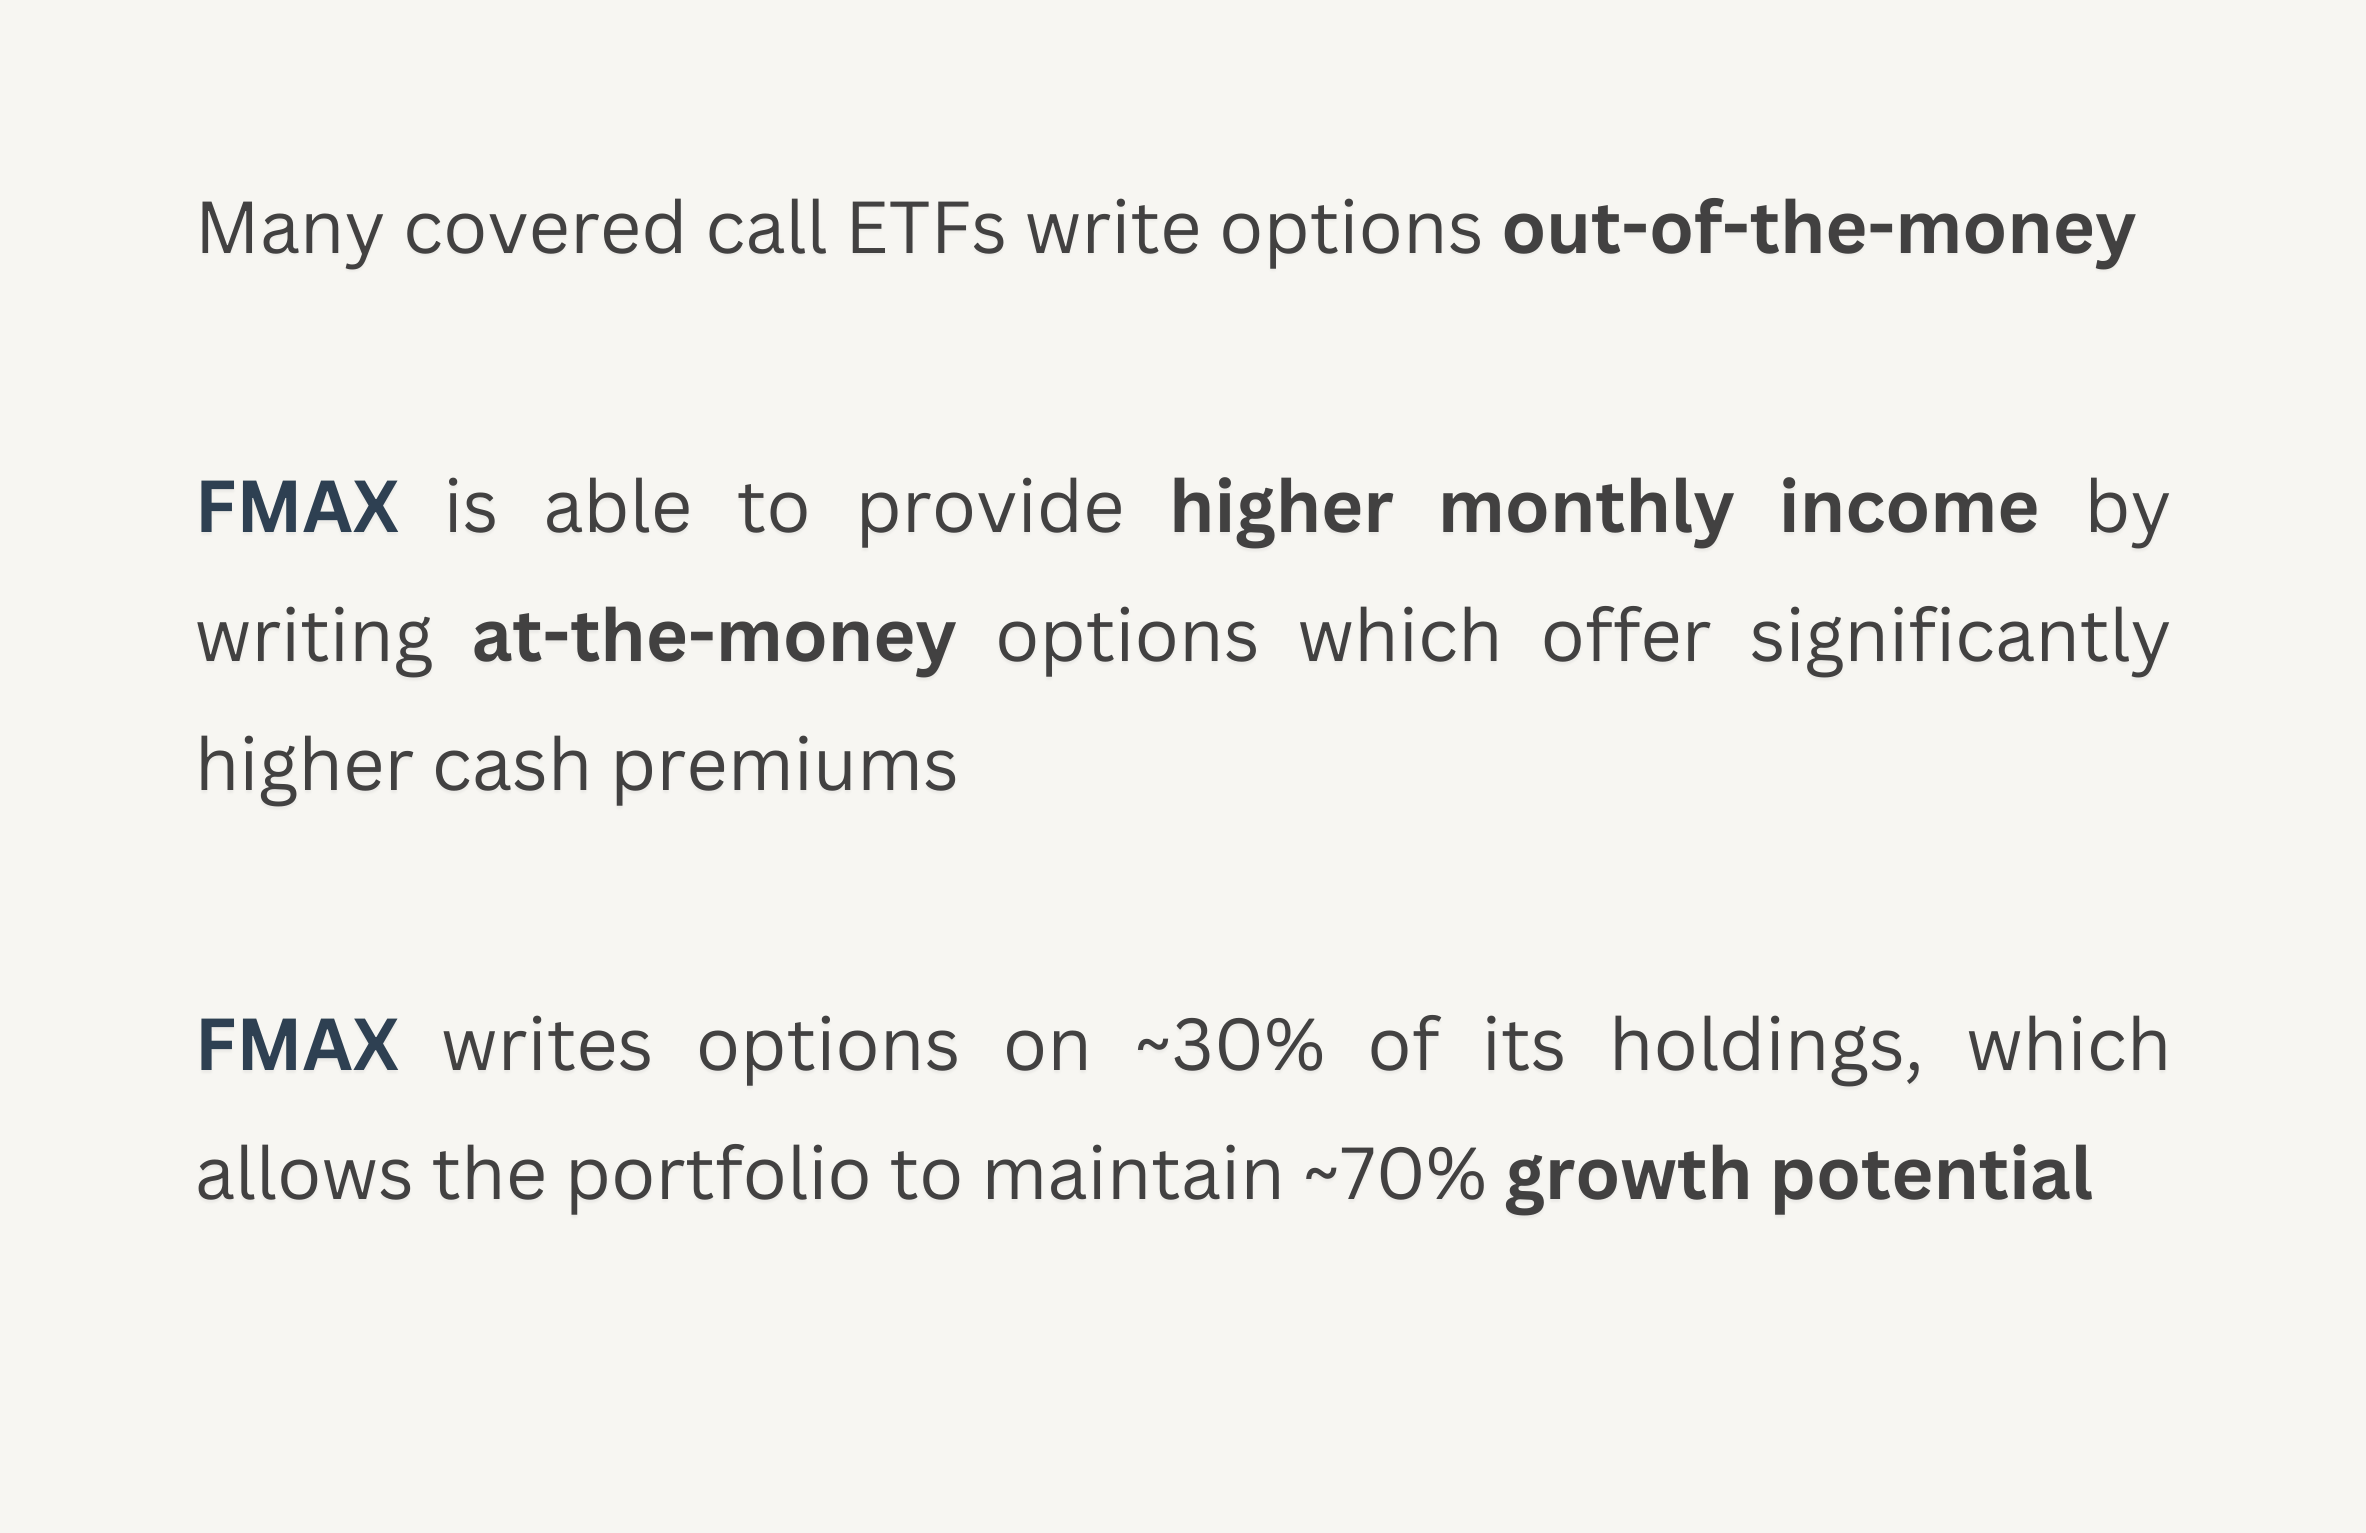
What Makes FMAX Different?
- Overview
- Distributions
- Documents
| ticker | name | weight |
| C | Citigroup Inc | 5.4% |
| GS | Goldman Sachs Group Inc/The | 5.4% |
| SCHW | Charles Schwab Corp/The | 5.3% |
| FI | Fiserv Inc | 5.3% |
| BAC | Bank of America Corp | 5.2% |
| JPM | JPMorgan Chase & Co | 5.2% |
| MS | Morgan Stanley | 5.1% |
| BLK | BlackRock Inc | 5.1% |
| AXP | American Express Co | 5.1% |
| BX | Blackstone Inc | 5.0% |
| BRK/B | Berkshire Hathaway Inc | 5.0% |
| PGR | Progressive Corp/The | 5.0% |
| SPGI | S&P Global Inc | 5.0% |
| MA | Mastercard Inc | 5.0% |
| CME | CME Group Inc | 5.0% |
| WFC | Wells Fargo & Co | 4.9% |
| ICE | Intercontinental Exchange Inc | 4.9% |
| MMC | Marsh & McLennan Cos Inc | 4.9% |
| CB | Chubb Ltd | 4.9% |
| V | Visa Inc | 4.7% |
| Ticker | FMAX |
| Exchange | Toronto Stock Exchange (TSX) |
| CUSIP | 407851104 |
| Inception Date | February 6, 2024 |
| Investment Style | U.S. Financials, Covered Call |
| Assets | $53.4M CAD* |
| Distributions | Monthly |
| Currency Hedging | None |
| Rebalancing | Semi-annual |
| Management Fee | 0.65% |
| Risk Rating | Medium |
| Auditor | KPMG LLP |
| Legal Entity Identifier | 254900WDRK09FX1X1Y60 |
| Ex-Dividend Date | Paid | Frequency | Amount |
|---|---|---|---|
| 2024-04-29 | 2024-05-07 | Monthly | $0.1630 |
| 2024-03-27 | 2024-04-05 | Monthly | $0.1605 |
| 2024-02-28 | 2024-03-07 | Monthly | $0.1600 |