
Hamilton U.S. Equity
YIELD MAXIMIZER™
ETF
Higher Income from U.S. Equity Leaders

HIGHLIGHTS
Last distribution of $0.165 per unit*Last distribution per unit. Distributions are subject to change. For a complete list of historical distributions, please see the Distributions tab below.; monthly distributions
Blue-chip U.S. equity exposure, with a sector mix similar to the S&P 500
Active covered call strategy managed by an experienced options team led by Nick Piquard, with 25+ years of experience specializing in options
A GOOD FIT FOR INVESTORS WHO WANT
Higher monthly income
Tax efficient distributions
Modest long-term growth potential from U.S. sector leaders
Reduced volatility from options strategy
INVESTMENT OBJECTIVE
SMAX is designed for attractive monthly income, while providing exposure to a portfolio of primarily large-cap U.S. equity securities. To reduce volatility and augment dividend income, SMAX will employ an active covered call strategy.
SMAX does not use leverage.
Performance
- TICKER SMAX
- NAV $17.67
- 1 DAY CHANGE -$0.12
-
LAST DISTRIBUTION *
Last distribution per unit. Distributions are subject to change. For a complete list of historical distributions, please see the Distributions tab below.
$0.165 - ASSETS $373.5M
Attractive Monthly Income
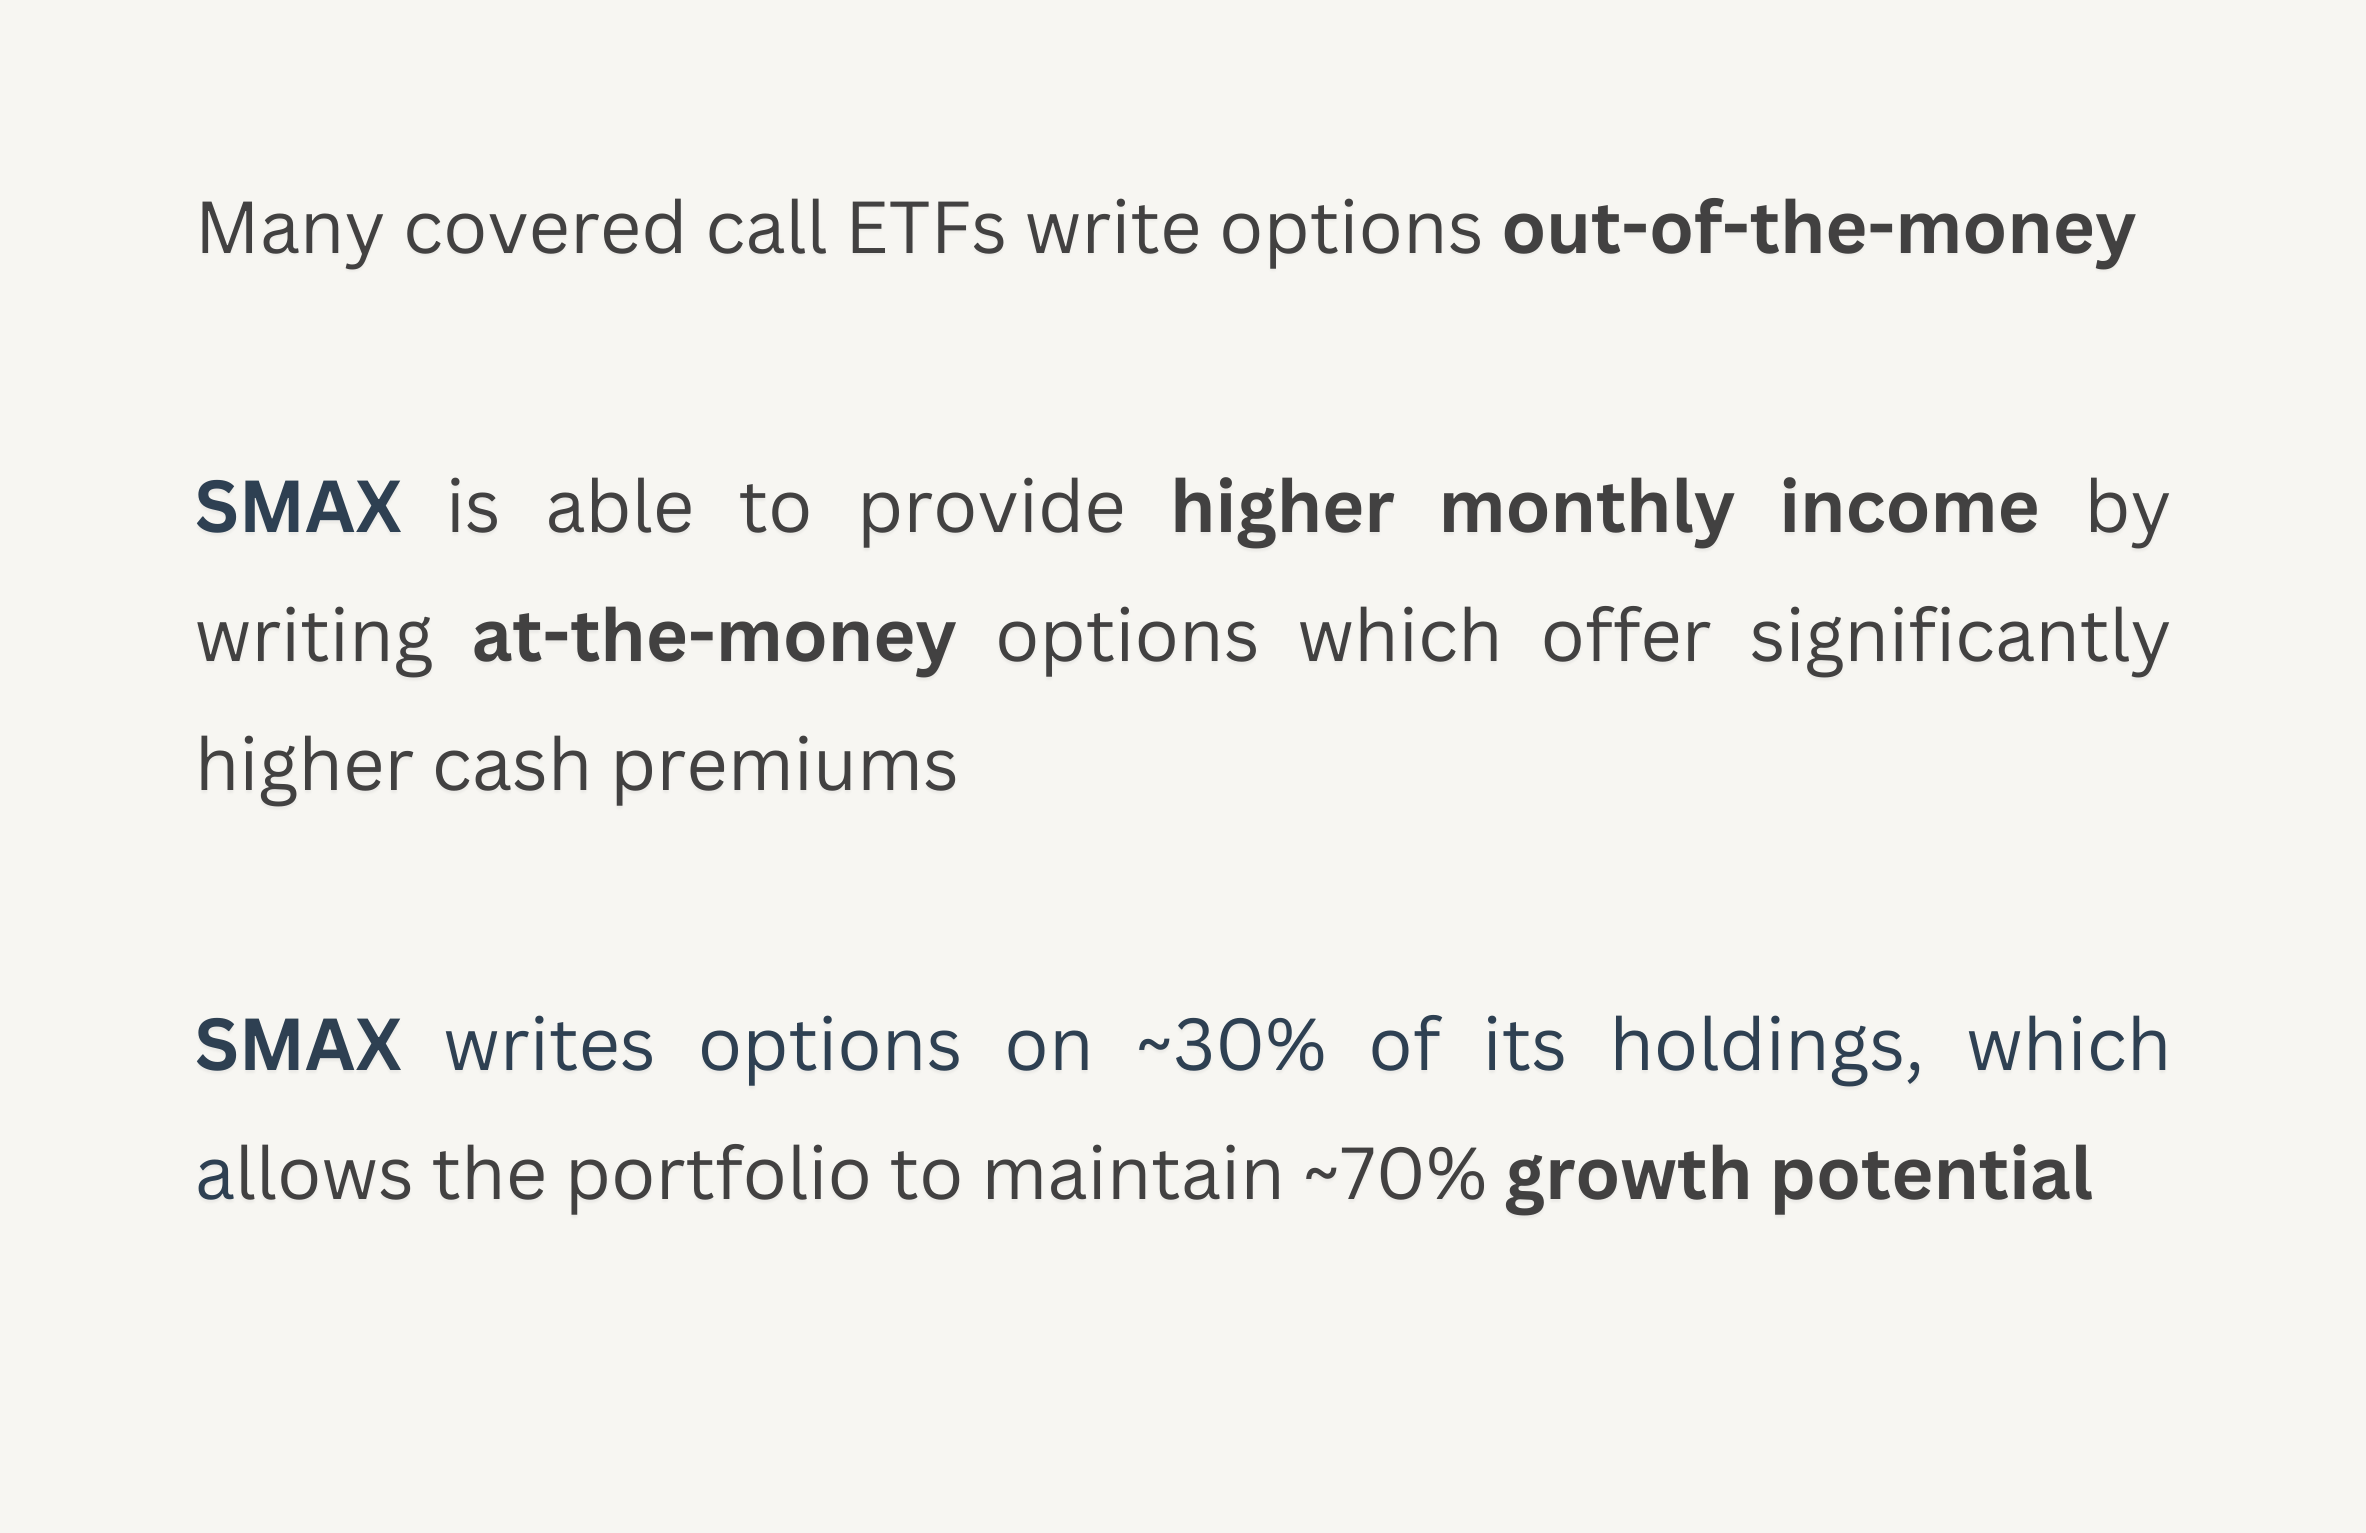
What Makes SMAX Different?
- Overview
- Distributions
- Documents
█ Consumer Discretionary 12.4%
█ Consumer Staples 4.0%
█ Energy 4.2%
█ Financials 8.3%
█ Health Care 12.1%
█ Industrials 8.3%
█ Real Estate 4.0%
█ Technology 31.8%
█ Utilities 4.2%
| ticker | name | weight |
| NEE | NextEra Energy Inc | 4.2% |
| AVGO | Broadcom Inc | 4.2% |
| TSLA | Tesla Inc | 4.2% |
| JPM | JPMorgan Chase & Co | 4.2% |
| XOM | Exxon Mobil Corp | 4.2% |
| CAT | Caterpillar Inc | 4.2% |
| GE | General Electric Co | 4.1% |
| BRK/B | Berkshire Hathaway Inc | 4.1% |
| AMZN | Amazon.com Inc | 4.1% |
| HD | Home Depot Inc/The | 4.1% |
| LLY | Eli Lilly & Co | 4.1% |
| CRM | Salesforce Inc | 4.0% |
| PLD | Prologis Inc | 4.0% |
| GOOGL | Alphabet Inc | 4.0% |
| UNH | UnitedHealth Group Inc | 4.0% |
| ADBE | Adobe Inc | 4.0% |
| JNJ | Johnson & Johnson | 4.0% |
| MSFT | Microsoft Corp | 4.0% |
| PG | Procter & Gamble Co/The | 4.0% |
| META | Meta Platforms Inc | 4.0% |
| NVDA | NVIDIA Corp | 4.0% |
| LIN | Linde PLC | 3.9% |
| V | Visa Inc | 3.9% |
| AAPL | Apple Inc | 3.9% |
| AMD | Advanced Micro Devices Inc | 3.8% |
| Ticker | SMAX |
| Exchange | Toronto Stock Exchange (TSX) |
| CUSIP | 407916105 |
| Inception Date | October 25, 2023 |
| Investment Style | U.S. Equity, Covered Call |
| Assets | $373.5M CAD* |
| Distributions | Monthly |
| Currency Hedging | None |
| Rebalancing | Semi-annual |
| Management Fee | 0.65% |
| Risk Rating | Low to Medium |
| Auditor | KPMG LLP |
| Legal Entity Identifier | 2549005JJY97H2CP5W16 |
| Ex-Dividend Date | Paid | Frequency | Amount |
|---|---|---|---|
| 2024-04-29 | 2024-05-07 | Monthly | $0.1700 |
| 2024-03-27 | 2024-04-05 | Monthly | $0.1650 |
| 2024-02-28 | 2024-03-07 | Monthly | $0.1650 |
| 2024-01-30 | 2024-02-09 | Monthly | $0.1610 |
| 2023-12-28 | 2024-01-08 | Monthly | $0.1600 |
| 2023-11-29 | 2023-12-07 | Monthly | $0.1600 |
You can view public filings for the Hamilton U.S. Equity YIELD MAXIMIZER™ ETF on SEDAR+.
Press Releases
View the latest SMAX Press Releases
Fact Sheet
SMAX Fact Sheet (2024-03-28) English Français
ETF Facts
SMAX ETF Facts (2023-09-08) English Français
Prospectus
SMAX Prospectus (2023-09-08) English Français
Financial Statements
Annual Financial Statements (2023-12-31) English Français
Independent Review Committee
2023 Annual Report to Securityholders (2024-03-13) Download