
Hamilton Enhanced
Utilities ETF
Get More from Canadian Utilities

HIGHLIGHTS
Exposure to 12 high dividend-paying Canadian Utility, Telecom, and Pipeline companies
Modest 25% cash leverage to enhance yield and return potential
Yield of 7.78%*An estimate of the annualized yield an investor would receive if the most recent distribution remained unchanged for the next 12 months, stated as a percentage of the price per unit on March 28, 2024 with monthly distributions
Solactive Canadian Utility Services High Dividend Index TR x 1.25 has outperformed the S&P/TSX Capped Utilities Index by 3.20%*Based on annualized returns from December 7, 2011 to March 28, 2024
A GOOD FIT FOR INVESTORS WHO WANT
Stable and consistent dividends from a relatively defensive sector
Enhanced yield and growth potential
Favourable tax treatment of Canadian sourced dividends
FUND OBJECTIVE
The investment objective of HUTS is to replicate, to the extent reasonably possible and before the deduction of fees and expenses, a 1.25 times multiple of a rules-based utilities index, currently the Solactive Canadian Utility Services High Dividend Index TR (SOLCUHDT).


Performance
- TICKER HUTS
- NAV $11.21
- 1 DAY CHANGE -$0.04
-
YIELD *
Current annualized yield, as at March 28, 2024
7.78% - ASSETS $80.8M
Total Returns (incl. Dividends)
- ticker 0.00%
- 1 month 0.85%
- 3 months -1.38%
- 6 months 11.17%
- year to date -1.38%
- 1 year -9.46%
- inception* -11.63%
- as of date 202400.00%
Benefits of Modest Leverage1
Since August 2012
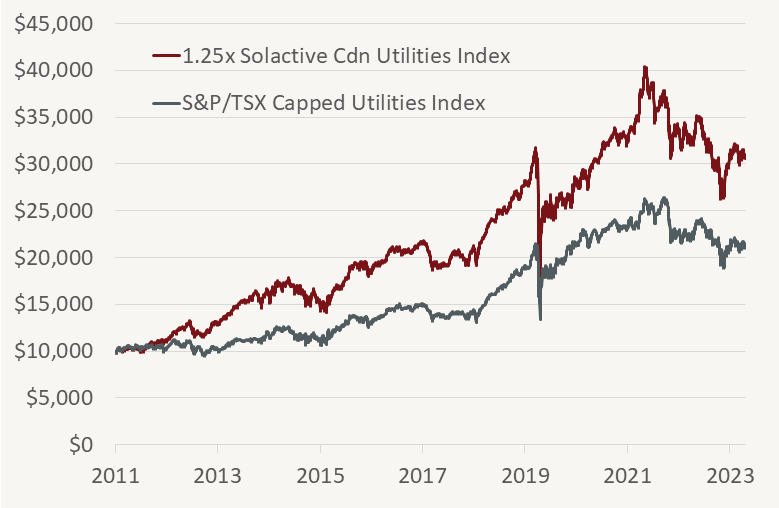
1Based on the Solactive Canadian Utility Services High Dividend Index TR (SOLCUHDT) x 1.25 versus the S&P/TSX Capped Utilities Index (TTUTAR), from December 7, 2011 to March 28, 2024. Source: Bloomberg, Solactive AG, Hamilton ETFs
Higher Yield2
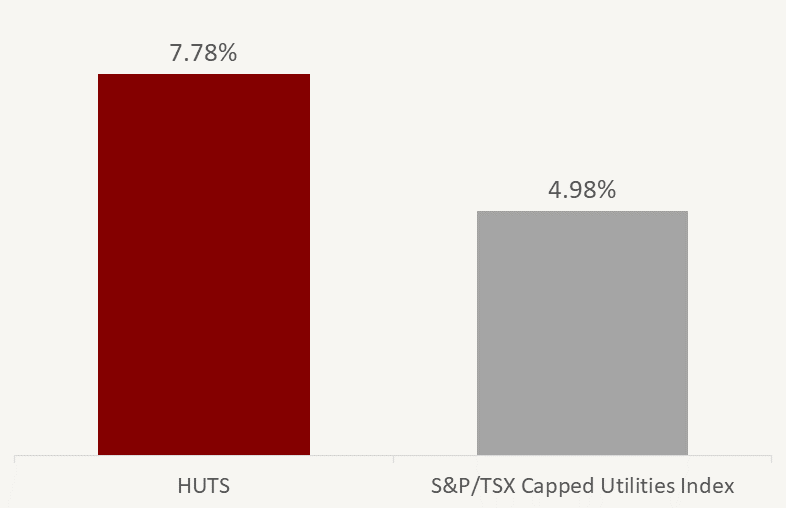
2Current annualized yields as at March 28, 2024. Source: Bloomberg, Hamilton ETFs
- Overview
- Distributions
- Documents
█ Telecoms 21.8%
█ Utilities 51.6%
| ticker | name | weight |
| BIP-U | Brookfield Infrastructure Part | 12.1% |
| ALA | AltaGas Ltd | 11.4% |
| TRP | TC Energy Corp | 11.3% |
| PPL | Pembina Pipeline Corp | 11.2% |
| ENB | Enbridge Inc | 11.0% |
| H | Hydro One Ltd | 11.0% |
| EMA | Emera Inc | 10.4% |
| FTS | Fortis Inc/Canada | 10.3% |
| BEP-U | Brookfield Renewable Partners | 9.7% |
| RCI/B | Rogers Communications Inc | 9.5% |
| T | TELUS Corp | 9.0% |
| BCE | BCE Inc | 8.8% |
| Total (including modest ~25% leverage) | 125.7% |
Please note the portfolio weights include modest ~25% leverage via cash borrowing (not derivatives), provided by a Canadian financial institution.
| Ticker | HUTS |
| Exchange | Toronto Stock Exchange (TSX) |
| CUSIP | 40737J104 |
| Inception Date | September 1, 2022 |
| Investment Style | Index-based, modest 25% leverage |
| Index | Solactive Canadian Utility Services High Dividend Index TR |
| Assets | $80.8M CAD* |
| Current Annualized Yield | 7.78%* |
| Distributions | Monthly |
| Rebalancing | Semi-Annual |
| Management Fee | 0.65%* |
| Risk Rating | Medium |
| Auditor | KPMG LLP |
| Legal Entity Identifier | 549300CVZNB3BWAKSN86 |
| Ex-Dividend Date | Paid | Frequency | Amount |
|---|---|---|---|
| 2024-04-29 | 2024-05-07 | Monthly | $0.076 |
| 2024-03-27 | 2024-04-05 | Monthly | $0.076 |
| 2024-02-28 | 2024-03-07 | Monthly | $0.076 |
| 2024-01-30 | 2024-02-09 | Monthly | $0.079 |
| 2023-12-28 | 2024-01-08 | Monthly | $0.079 |
| 2023-11-29 | 2023-12-07 | Monthly | $0.079 |
| 2023-10-30 | 2023-11-07 | Monthly | $0.079 |
| 2023-09-28 | 2023-10-06 | Monthly | $0.079 |
| 2023-08-30 | 2023-09-08 | Monthly | $0.079 |
| 2023-07-28 | 2023-08-08 | Monthly | $0.079 |
| 2023-06-29 | 2023-07-10 | Monthly | $0.079 |
| 2023-05-30 | 2023-06-07 | Monthly | $0.079 |
| 2023-04-27 | 2023-05-05 | Monthly | $0.079 |
| 2023-03-30 | 2023-04-13 | Monthly | $0.079 |
| 2023-02-27 | 2023-03-10 | Monthly | $0.079 |
| 2023-01-30 | 2023-02-10 | Monthly | $0.079 |
| 2022-12-29 | 2023-01-12 | Monthly | $0.079 |
| 2022-11-29 | 2022-12-12 | Monthly | $0.079 |
| 2022-10-28 | 2022-11-10 | Monthly | $0.079 |
You can view public filings for the Hamilton Enhanced Canadian Utilities ETF on SEDAR+.
Press Releases
View the latest HUTS Press Releases
Fact Sheet
HUTS Fact Sheet (2024-03-28) English Français
ETF Facts
HUTS ETF Facts (2023-06-07) English Français
Prospectus
HUTS Prospectus (2023-06-07) English Français
Financial Statements
Annual Financial Statements (2023-12-31) English Français
Interim Financial Statements (2023-06-30) English Français
Latest Portfolio Summary
Q3 2023 Portfolio Summary (2023-09-30) Download
Independent Review Committee
2023 Annual Report to Securityholders (2024-03-13) Download