
Hamilton Enhanced
Canadian Financials ETF
Get More from Canadian Banks & Insurers

HIGHLIGHTS
Equal-weight portfolio of Canada’s 12 largest financial services companies
Yield of 5.64%*An estimate of the annualized yield an investor would receive if the most recent distribution remained unchanged for the next 12 months, stated as a percentage of the price per unit on March 28, 2024 with monthly distributions
Modest 25% cash leverage to enhance yield and return potential
Solactive Canadian Financials Equal-Weight Index TR x 1.25 has outperformed the S&P/TSX Capped Financials Index by 3.41%*Based on annualized returns since inception on April 29, 2011, as at March 28, 2024
A GOOD FIT FOR INVESTORS WHO WANT
Attractive monthly distributions
Enhanced yield and growth potential
Diversified exposure to Canada’s large-cap banks and insurers
FUND OBJECTIVE
HFIN seeks to replicate a 1.25 times multiple of the Solactive Canadian Financials Equal-Weight Index TR (SOLCAFNT), comprised of equal-weightings of the top 12 largest Canadian financial services companies, while adding modest 25% cash leverage to enhance growth potential and yield.

Performance
- TICKER HFIN
- NAV $15.27
- 1 DAY CHANGE -$0.07
-
YIELD *
Current annualized yield, as at March 28, 2024
5.64% - ASSETS $121.5M
Total Returns (incl. Dividends)
- ticker 0.00%
- 1 month 4.76%
- 3 months 9.56%
- 6 months 27.35%
- year to date 9.56%
- 1 year 29.14%
- inception* 6.54%
- as of date 202400.00%
Benefits of Modest Leverage1
Since April 2011
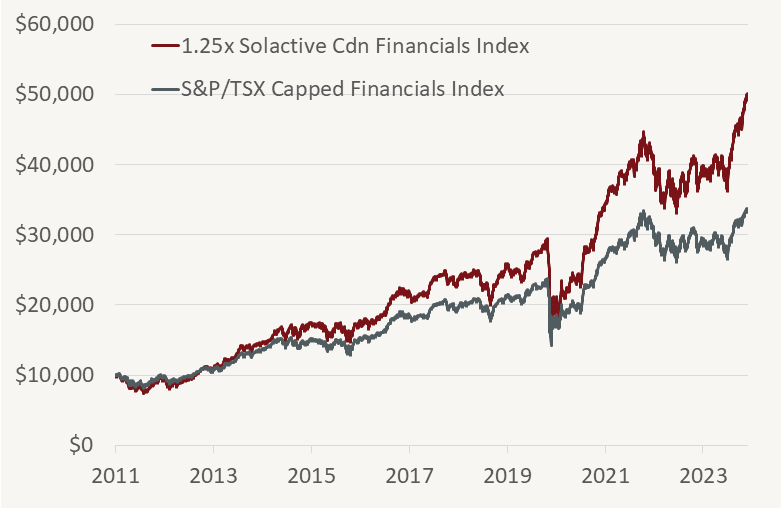
1Based on Solactive Canadian Financials Equal-Weight Index TR (SOLCAFNT) x 1.25 and Canadian Financials as represented by the S&P/TSX Capped Financials Index (SPTSFN) from April 29, 2011 to March 28, 2024. Source: Bloomberg, Solactive AG, Hamilton ETFs
Higher Yield2
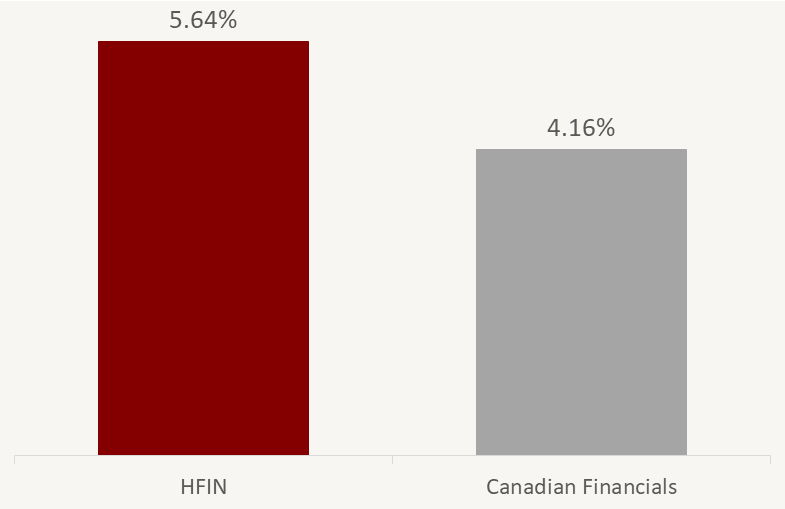
2Current annualized yield. Canadian Financials as represented by the S&P/TSX Capped Financials Index (SPTSFN), at March 28, 2024. Source: Bloomberg, Hamilton ETFs
- Overview
- Distributions
- Documents
█ Banks 50.3%
█ Insurance 40.5%
| ticker | name | weight |
| CM | Canadian Imperial Bank of Commerce | 11.7% |
| MFC | Manulife Financial | 11.5% |
| BN | Brookfield Corp | 11.4% |
| NA | National Bank of Canada | 11.0% |
| BMO | Bank of Montreal | 10.5% |
| FFH | Fairfax Financial Holdings | 10.4% |
| BNS | Bank of Nova Scotia | 10.3% |
| RY | Royal Bank of Canada | 10.1% |
| SLF | Sun Life Financial | 9.6% |
| GWO | Great-West Lifeco | 9.3% |
| IFC | Intact Financial | 9.2% |
| TD | Toronto-Dominion Bank | 8.7% |
| Total (including modest ~25% leverage) | 123.7% |
Please note the portfolio weights include modest ~25% leverage via cash borrowing (not derivatives), provided by a Canadian financial institution.
| Ticker | HFIN |
| Exchange | Toronto Stock Exchange (TSX) |
| CUSIP | 407364108 |
| Inception Date | January 26, 2022 |
| Investment Style | Index-based, modest 25% leverage |
| Benchmark | Solactive Canadian Financials Equal-Weight Index TR |
| Assets | $121.5M CAD* |
| Current Annualized Yield | 5.64%* |
| Distributions | Monthly |
| Rebalancing | Semi-Annual |
| Management Fee | 0.65% |
| Risk Rating | Medium to High |
| Auditor | KPMG LLP |
| Legal Entity Identifier | 549300COL2AQM2EJU464 |
| Ex-Dividend Date | Paid | Frequency | Amount |
|---|---|---|---|
| 2024-04-29 | 2024-05-07 | Monthly | $0.0750 |
| 2024-03-27 | 2024-04-05 | Monthly | $0.0750 |
| 2024-02-28 | 2024-03-07 | Monthly | $0.0750 |
| 2024-01-30 | 2024-02-09 | Monthly | $0.0750 |
| 2023-12-28 | 2024-01-08 | Monthly | $0.0750 |
| 2023-11-29 | 2023-12-07 | Monthly | $0.0750 |
| 2023-10-30 | 2023-11-07 | Monthly | $0.0750 |
| 2023-09-28 | 2023-10-06 | Monthly | $0.0750 |
| 2023-08-30 | 2023-09-08 | Monthly | $0.0750 |
| 2023-07-28 | 2023-08-08 | Monthly | $0.0750 |
| 2023-06-29 | 2023-07-10 | Monthly | $0.0750 |
| 2023-05-30 | 2023-06-07 | Monthly | $0.0750 |
| 2023-04-27 | 2023-05-05 | Monthly | $0.0750 |
| 2023-03-30 | 2023-04-13 | Monthly | $0.0750 |
| 2023-02-27 | 2023-03-10 | Monthly | $0.0750 |
| 2023-01-30 | 2023-02-10 | Monthly | $0.0750 |
| 2022-12-29 | 2023-01-12 | Monthly | $0.0750 |
| 2022-11-29 | 2022-12-12 | Monthly | $0.0750 |
| 2022-10-28 | 2022-11-10 | Monthly | $0.0750 |
| 2022-09-28 | 2022-10-13 | Monthly | $0.0750 |
| 2022-08-30 | 2022-09-13 | Monthly | $0.0750 |
| 2022-07-28 | 2022-08-11 | Monthly | $0.0750 |
| 2022-06-29 | 2022-07-13 | Monthly | $0.0750 |
| 2022-05-30 | 2022-06-10 | Monthly | $0.0725 |
| 2022-04-28 | 2022-05-11 | Monthly | $0.0725 |
| 2022-03-30 | 2022-04-12 | Monthly | $0.0725 |
You can view public filings for the Hamilton Enhanced Canadian Financials ETF on SEDAR+.
Press Releases
View the latest HFIN Press Releases
Fact Sheet
HFIN Fact Sheet (2024-03-28) English Français
ETF Facts
HFIN ETF Facts (2024-01-12) English Français
Prospectus
HFIN Prospectus (2024-01-12) English Français
Financial Statements
Annual Financial Statements (2023-12-31) English Français
Interim Financial Statements (2023-06-30) English Français
Latest Portfolio Summary
Q3 2023 Portfolio Summary (2023-09-30) Download
Independent Review Committee
2023 Annual Report to Securityholders (2024-03-13) Download