
Hamilton Technology
YIELD MAXIMIZER™
ETF
Higher Income from U.S. Tech Leaders

HIGHLIGHTS
Last distribution of $0.193 per unit*Last distribution per unit. Distributions are subject to change. For a complete list of historical distributions, please see the Distributions tab below.; monthly distributions
Exposure to the largest tech companies in the U.S.
Active covered call strategy managed by an experienced options team led by Nick Piquard, with 25+ years of experience specializing in options
A GOOD FIT FOR INVESTORS WHO WANT
Higher monthly income
Tax efficient distributions
Modest long-term growth potential from U.S. tech leaders
Reduced volatility from options strategy
INVESTMENT OBJECTIVE
QMAX is designed for attractive monthly income, while providing exposure to a portfolio of primarily large-cap U.S. technology equity securities. To reduce volatility and augment dividend income, QMAX will employ an active covered call strategy.
QMAX does not use leverage.
Performance
- TICKER QMAX
- NAV $18.80
- 1 DAY CHANGE -$0.08
-
LAST DISTRIBUTION *
Last distribution per unit. Distributions are subject to change. For a complete list of historical distributions, please see the Distributions tab below.
$0.193 - ASSETS $261.1M
Attractive Monthly Income
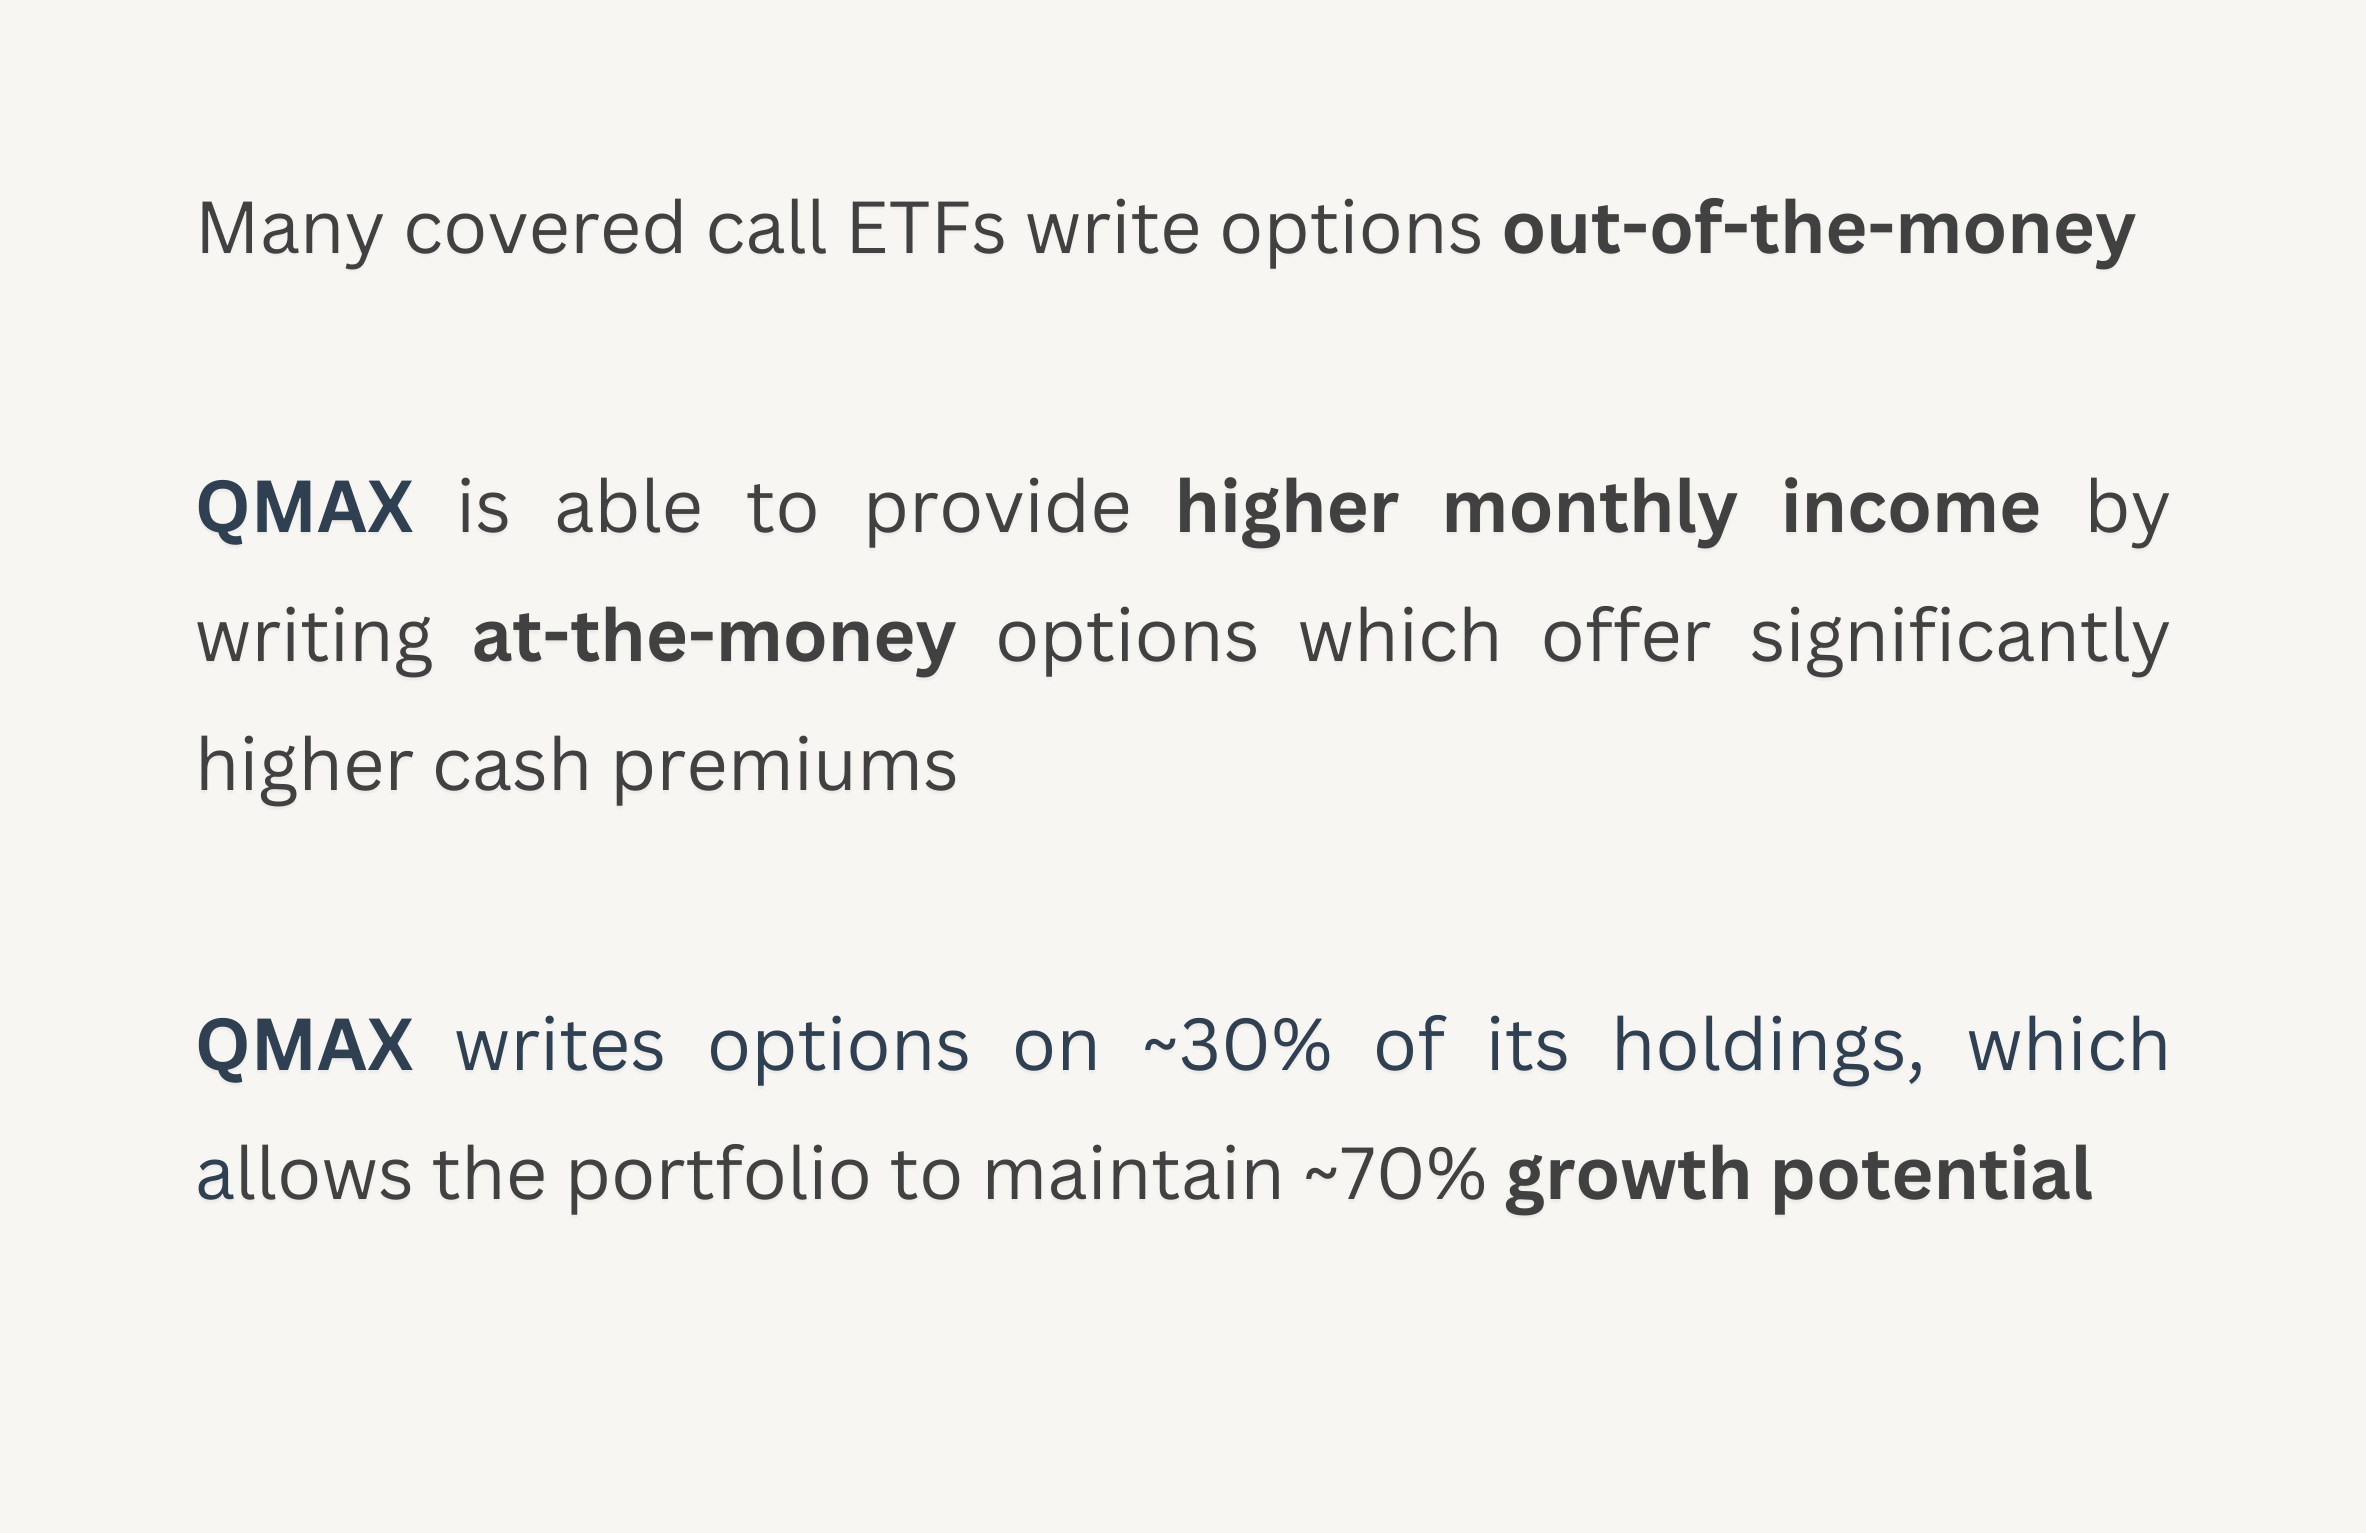
What Makes QMAX Different?
- Overview
- Distributions
- Documents
| ticker | name | weight |
| AVGO | Broadcom Inc | 7.1% |
| TSLA | Tesla Inc | 6.9% |
| INTU | Intuit Inc | 6.9% |
| INTC | Intel Corp | 6.9% |
| AMZN | Amazon.com Inc | 6.9% |
| AMAT | Applied Materials Inc | 6.8% |
| QCOM | QUALCOMM Inc | 6.8% |
| MSFT | Microsoft Corp | 6.7% |
| NVDA | NVIDIA Corp | 6.7% |
| ADBE | Adobe Inc | 6.7% |
| GOOGL | Alphabet Inc | 6.7% |
| META | Meta Platforms Inc | 6.6% |
| NFLX | Netflix Inc | 6.6% |
| AAPL | Apple Inc | 6.5% |
| AMD | Advanced Micro Devices Inc | 6.3% |
| Ticker | QMAX |
| Exchange | Toronto Stock Exchange (TSX) |
| CUSIP | 407915107 |
| Inception Date | October 25, 2023 |
| Investment Style | U.S. Technology, Covered Call |
| Assets | $261.1M CAD* |
| Distributions | Monthly |
| Currency Hedging | None |
| Rebalancing | Semi-annual |
| Management Fee | 0.65% |
| Risk Rating | Low to Medium |
| Auditor | KPMG LLP |
| Legal Entity Identifier | 254900O2UJFT0T35EK45 |
| Ex-Dividend Date | Paid | Frequency | Amount |
|---|---|---|---|
| 2024-04-29 | 2024-05-07 | Monthly | $0.2000 |
| 2024-03-27 | 2024-04-05 | Monthly | $0.1930 |
| 2024-02-28 | 2024-03-07 | Monthly | $0.1900 |
| 2024-01-30 | 2024-02-09 | Monthly | $0.1850 |
| 2023-12-28 | 2024-01-08 | Monthly | $0.1800 |
| 2023-11-29 | 2023-12-07 | Monthly | $0.1800 |
You can view public filings for the Hamilton Technology YIELD MAXIMIZER™ ETF on SEDAR+.
Press Releases
View the latest QMAX Press Releases
Fact Sheet
QMAX Fact Sheet (2024-03-28) English Français
ETF Facts
QMAX ETF Facts (2023-09-08) English Français
Prospectus
QMAX Prospectus (2023-09-08) English Français
Financial Statements
Annual Financial Statements (2023-12-31) English Français
Independent Review Committee
2023 Annual Report to Securityholders (2024-03-13) Download