
U.S. Bank Portfolio Outgrows U.S. Bank Peers for the 9th Consecutive Quarter
Hamilton Capital Global Bank ETF (HBG) continues to enjoy material outperformance with comparatively low drawdowns. Since inception, it has reported a 17% annualized return and is 20.3% ahead of the global bank index (in CAD)1. Year-to-date, HBG is up 3.9% which compares to a decline in the global bank index of ~2% (in CAD) adding a further 600 bps of outperformance in 7 months.
It has been a sea of red across global banking with virtually all major indices down over the first 7 months of 2018. For example, as of July 31st, the following major global bank indices are down: European banks (down ~9%), UK banks (down ~6%), Japanese banks (down ~11%), Australian banks (down ~4%), emerging market banks (down ~5%, including Chinese banks down ~3%). Only the U.S. and Canadian banks are up over this period (rising 2.1% and 2.6%, respectively), albeit still less than HBG.
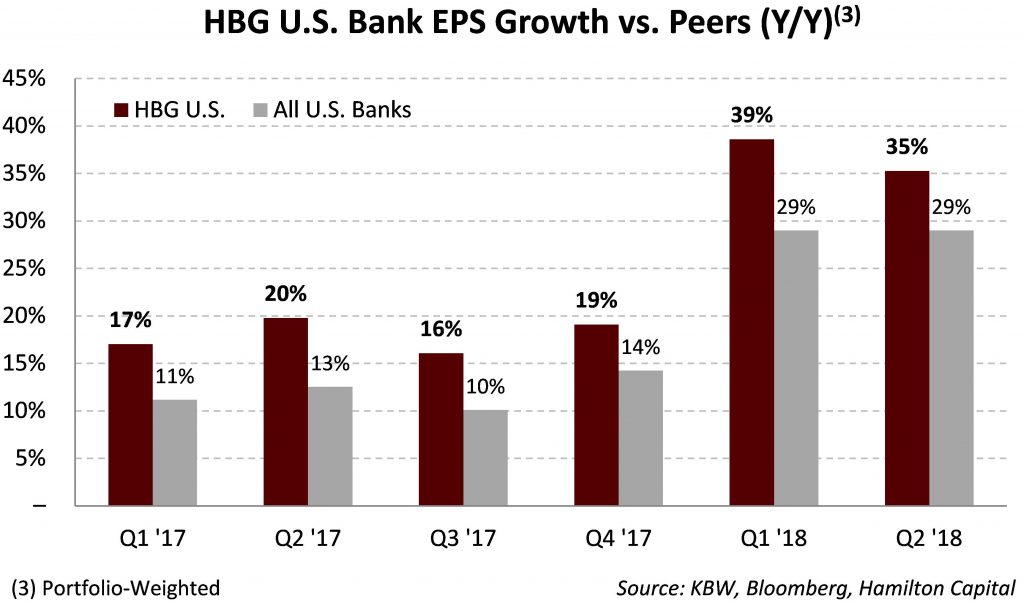
Contributing to this large outperformance is the fundamental outperformance of HBG’s U.S. bank portfolio, generally representing ~45% of the ETF. In Q2-18, this portfolio reported year-over-year portfolio-weighted EPS growth of 35%, or a highly material 600 bps ahead of the U.S. banks (see chart; source KBW).
Importantly, this was the 9th consecutive quarter where the U.S. banks in HBG grew materially faster than the sector. Contributing to this sustained EPS growth outperformance is the U.S. mid-cap banks’ favorable geographic footprint in MSA’s2 with higher GDP growth than the national average and this in turn allows the portfolio to benefit from higher EPS growth. This quarter, the portfolio also gained from its greater interest rate sensitivity which resulted in margin expansion amid strong credit demand and stable asset quality.
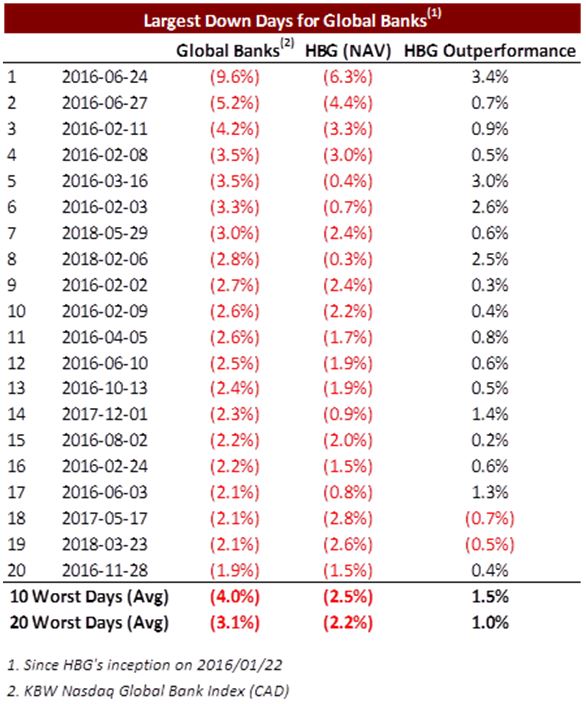
Also, for those investors concerned about a market correction, HBG also had comparatively low drawdowns during the two large macro corrections (Brexit and Yuan devaluation) since it was launched. In fact, it has outperformed in 18 of the 20 worst days since its inception (see table below).
Notes
1 Global banks index represented by the KBW Nasdaq Global Bank Net Total Return Index, the GBKXN Index; As at July 31st, 2018
3 An MSA is typically a large city and outlying suburbs, analogous to the Greater Toronto Area (“GTA”). MSAs are defined by the U.S. Office of Management and Budget.
Note: Comments, charts and opinions offered in this commentary are produced by Hamilton Capital and are for information purposes only. They should not be considered as advice to purchase or to sell mentioned securities. Any information offered is believed to be accurate, but is not guaranteed.