

The European banking sector includes some of the world’s largest banks, making its health and profitability very important to the global markets. Given the sustained weakness in the sector (the STOXX Europe 600 Banks has fallen ~30% since the beginning of 2018), we thought it would be helpful to review key balance sheet and income statement trends – in 14 charts – since the European sovereign debt crisis (2011/2012).
Note to Reader: This Insight includes references to certain Hamilton ETFs that were active at the time of writing. On June 29, 2020, the following mergers took place: (i) Hamilton Global Financials Yield ETF and Hamilton Global Bank ETF into the Hamilton Global Financials ETF (HFG), (ii) Hamilton Australian Financials Yield ETF into the Hamilton Australian Bank Equal-Weight Index ETF (HBA); (iii) Hamilton Canadian Bank Variable-Weight ETF into the Hamilton Canadian Bank Mean Reversion Index ETF (HCA), and (iv) Hamilton U.S. Mid-Cap Financials ETF (USD) into the Hamilton U.S. Mid/Small-Cap Financials ETF (HUM).
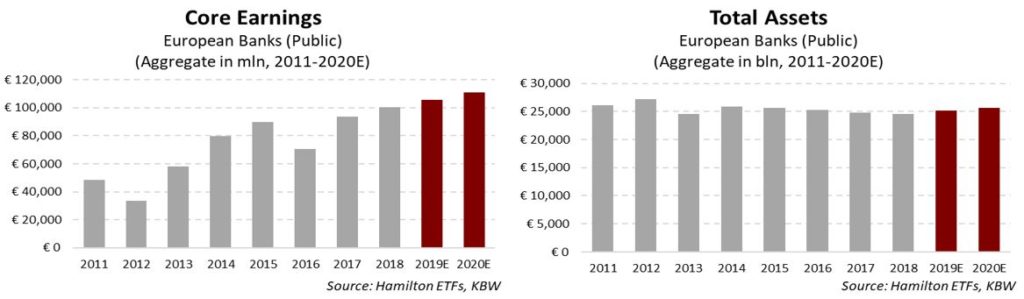
While sentiment surrounding the sector is highly bearish, these charts demonstrate the “reality” is much more complicated given the large number of variables impacting profitability. For example, despite the significant pressure on European bank stocks from persistent macro risks, profits for the sector actually rose to €100 bln in 2018 from €93 bln in the prior year (and €71 bln in 2016).
One of the most significant risks for the sector is the impact of ultra-low, if not negative, interest rates on net interest margins (NIMs). Because the low rates are related to concerns around weaker economic growth, these two factors together have weighed on valuations for the European banking sector despite (still) growing earnings. That said, this earnings growth has been supported in the last five years by falling loan losses, which have more than offset the negative impact of lower NIMs (that have been manageable so far).
We would emphasize that it is very difficult to generalize Europe, given the sheer number of countries and diversity of regions. We group Europe into five distinct regions: (i) higher growth Central and Eastern Europe (including Poland and other former satellite countries of the former USSR), (ii) very wealthy, well-governed Northern Europe (including Norway, Sweden, Denmark), (iii) United Kingdom and Ireland, (iv) Western Europe (including Germany, France, Belgium, Netherlands), and (v) peripheral Europe (Italy, Portugal, Greece and the much reformed Spain).
In March, we reduced our European bank exposure by 10% in our global ETFs. Specifically, we reduced Hamilton Global Financials Yield ETF (HFY) to 7% in favour of higher weights in U.S., Canada and Australian financials. In the Hamilton Global Bank ETF (HBG), we reduced the exposure to 15% in favour of cash initially, before increasing the U.S. bank weights. Given the significant weakness in European bank stocks since then, this rebalance contributed positively to the ETFs’ absolute and relative performance, with HFY having outperformed the global financials by ~300 bps and HBG having outperformed the global banks by ~400 bps.1
The charts below show key balance sheet and income trends for the ~70 largest European banks covered by Keefe, Bruyette & Woods (“KBW”), with 2019 and 2020 estimates by KBW indicated in burgundy. As of 2018 year-end, these banks had combined assets of €25 trillion and loans of €11.6 trillion.
Charts 1 and 2: “Core” Bank Earnings Rising Steadily Despite Muted Balance Sheet Growth
In 2018, core European bank earnings rose to over €100 bln, up from €94 bln a year earlier. Notably, this rise in profitability was achieved on a slightly smaller asset base of ~€24.5 trillion, which has actually fallen ~€1.0 trillion in the past three years. At over €100 bln, earnings for the sector are now roughly equal to earnings before the global financial crisis and three times higher than the earnings trough during the European sovereign debt crisis low of €33 bln (in 2012).
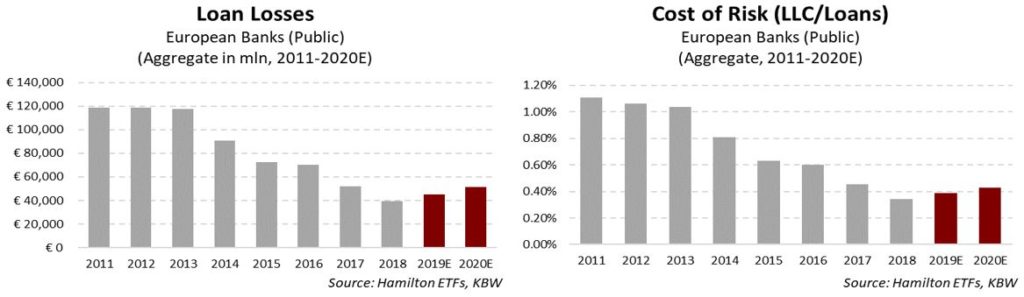
Charts 3 and 4: Falling Loan Losses the Dominant Driver of Earnings Growth
The largest driver of rising profitability for the European banks was a substantial decline in loan losses. Since the European sovereign debt crisis and its after-effects, loan losses have declined from €119 bln in 2012 to just €39 bln in 2018. Not surprisingly, this resulted in a commensurate decline in the cost-of-risk ratio over the same time frame, from over 100 bps to just 34 bps.
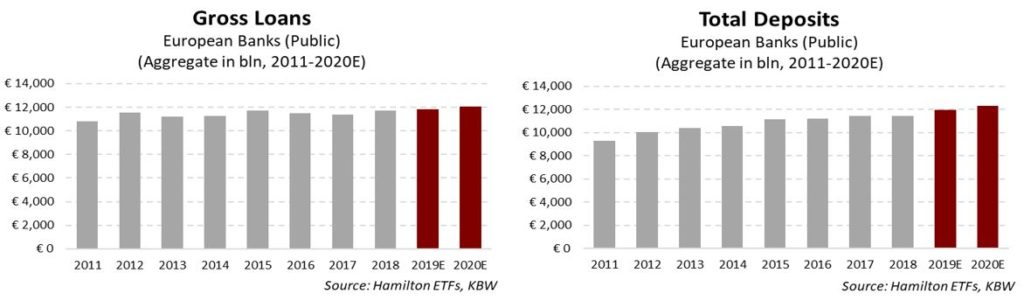
Charts 5 and 6: Loans and Deposits Trending Higher
Although the asset base for the sector has gradually declined, loans and deposits have gradually trended higher. Deposit growth has been respectable, rising over 10% in the last five years to €11.5 trillion from €10.3 trillion. Over this same period, gross loans rose a meagre 4% to €11.7 trillion, up from €11.2 trillion. While loan growth has been tepid, it should be noted that it was weighed down by an effort to increase capital, in part from reducing risk-weighted assets (RWAs) – including loans – which have declined nearly €1 trillion over the same period.
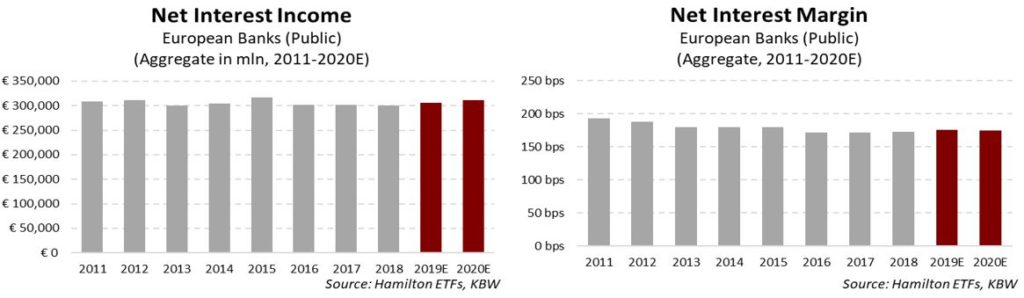
Charts 7 and 8: Net Interest Income Flattish Since Crisis; Lower NIMs Offset Loan Growth
As the interest rate environment became increasingly challenged, net interest income declined to €300 bln from €310 bln a few years ago; the benefits of modest loan growth were largely offset by lower net interest margins, which declined by ~15 bps to 173 bps.
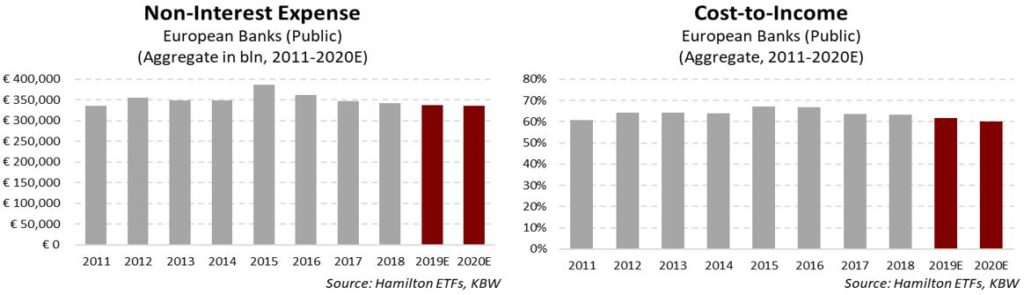
Charts 9 and 10: Productivity Improvements from Falling Operating Expenses
Non-interest expenses are almost identical to levels from five years ago at €340 bln. However, expenses are down meaningfully from €385 bln three years ago causing the productivity ratio (cost-to-income) to decline 400 bps from 67% to 63%. These efficiency improvements have also supported profit growth over the past several years.
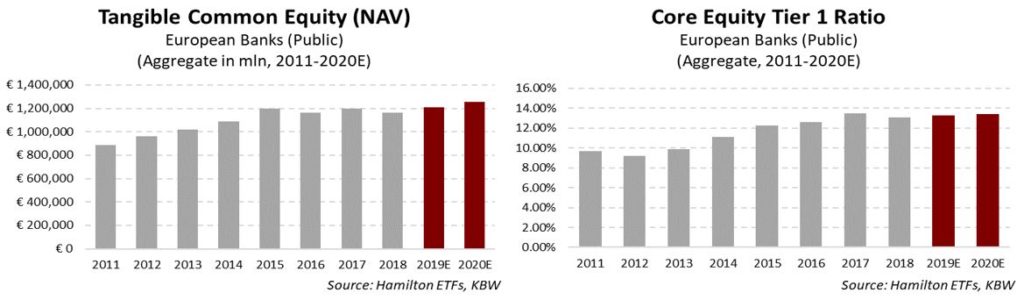
Charts 11 and 12: Highest Quality Capital ~30% Higher than Sovereign Debt Crisis
At ~€1.2 trillion, tangible common equity (TCE) has remained stable in the last five years. However, it is a very substantial €300 bln (or over 30%) higher than the European sovereign debt crisis low €880 bln in 2011, and more than double the global financial credit crisis low of €575 bln in 2007.
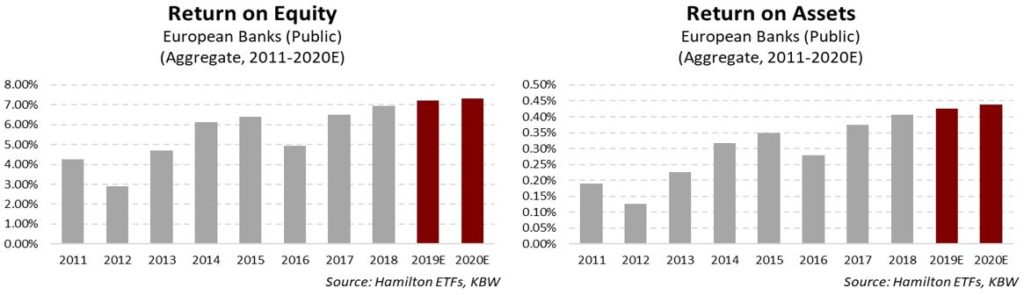
Charts 13 and 14: ROEs and ROA Low, but Improving
Although earnings have risen materially, profitability metrics remain low compared to other developed markets like Canada, Australia and the United States, with an aggregate ROTCE of 8.5% (ROE of ~7%) and return on assets (ROA) of 41 bps.
An Already Complicated Picture Getting More Complicated
Overall, the charts above present a complicated picture of European bank profitability, with a large decline in stock prices taking place during a significant credit-driven improvement in earnings. That said, future earnings growth for the sector is going to be more difficult given credit normalization has likely peaked.
For European bank stocks and valuations to rise, macro risks (including political) will have to decline and the sector will need EPS growth driven by loan growth and higher margins. The latter will be more difficult to achieve in the low GDP growth environment experienced by most of the largest countries in Europe.
____
A word on trading liquidity for ETFs …
Hamilton ETFs are highly liquid ETFs that can be purchased and sold easily. ETFs are as liquid as their underlying holdings and the underlying holdings trade millions of shares each day.
How does that work? When ETF investors are buying (or selling) in the market, they may transact with another ETF investor or a market maker for the ETF. At all times, even if daily volume appears low, there is a market maker – typically a large bank-owned investment dealer – willing to fill the other side of the ETF order (at net asset value plus a spread). The market maker then subscribes to create or redeem units in the ETF from the ETF manager (e.g., Hamilton ETFs), who purchases or sells the underlying holdings for the ETF.