

In Q4 2018, we expanded our ETF offering to include two ETFs with monthly distributions and exposure to two world-class – and very similar – financial sectors with excellent performance histories. In October, we launched the Hamilton Capital Canadian Bank Variable-Weight ETF (HCB), a rules-based strategy that seeks to capitalize on the historical mean reversion tendencies of the Canadian banking sector[1]. In December, we launched the Hamilton Capital Australian Financials Yield ETF (HFA), offering exposure to one of the world’s strongest financial sectors and a targeted yield of 6.5%+ supported by covered calls[2].
Note to Reader: This Insight includes references to certain Hamilton ETFs that were active at the time of writing. On June 29, 2020, the following mergers took place: (i) Hamilton Global Financials Yield ETF and Hamilton Global Bank ETF into the Hamilton Global Financials ETF (HFG), (ii) Hamilton Australian Financials Yield ETF into the Hamilton Australian Bank Equal-Weight Index ETF (HBA); (iii) Hamilton Canadian Bank Variable-Weight ETF into the Hamilton Canadian Bank Mean Reversion Index ETF (HCA), and (iv) Hamilton U.S. Mid-Cap Financials ETF (USD) into the Hamilton U.S. Mid/Small-Cap Financials ETF (HUM).
Arguably, no two countries – and their financial sectors – are more similar than Canada and Australia. Historically, both countries have had strong economies and favourable demographics supported by large-scale, skilled immigration. Their financial sectors are oligopolies, dominated by large world-class banks.
The similarities extend to their housing sectors as well. Both Canada and Australia have experienced a comparable long-term rise in home prices resulting in fears that a rapid/large correction could cause an economic downturn (if not an outright recession). This speculation has been amplified by recent home price declines in large cities like Vancouver, Toronto, Melbourne, and Sydney and the intense coverage by the financial media.
Rising home prices, combined with the excellent share price performance[3], have made the two banking sectors the target of short sellers, with many even drawing comparisons to the 2008-2009 U.S. housing crisis. Central to this bearish thesis is an expected “direct hit” to the banks from rising losses from their huge mortgage portfolios.
In this Insight, we provide 6 reasons why we believe the impact to the banks of the ongoing home price correction is more likely to be manageable and indirect (headwind to GDP) versus severe and direct (a rapid rise in loan losses).
1. Collateral, mortgage insurance provide huge buffers to direct losses for the banks
An important buffer against direct mortgage credit losses is the value of the house (i.e., the collateral). In the event of default, the bank seizes the home and sells it to repay the loan. Therefore, a key measure to evaluate mortgage credit risk is to compare the loan balance to the value of the home, a ratio called loan-to-value (LTV); the lower the ratio, the lower the credit risk. As home prices change, the value of the home is updated and used to calculate what is referred to as the dynamic LTV.
For the Australian and Canadian banks, the dynamic (mortgage) portfolio LTV ratios are very low at around 50%. Put differently, for every $100 of residential mortgage loans, the banks have roughly $200 in home value as collateral. Moreover, credit risk for the riskiest mortgages – those with the highest LTV ratios – is further reduced by the fact that these higher-risk borrowers are generally required to buy mortgage insurance (to insure the bank against their own potential default).This combination of significant collateral and mortgage insurance on the highest-risk loans means it would take a truly significant decline in home prices for Canadian and Australian banks to incur a large increase in direct mortgage credit losses.
2. Inflation/growth trade-off not as stark for central banks (as in prior housing corrections)
One of the most important drivers of historical home price corrections has been a rapid/sustained rise in interest rates. In several past cycles, central banks significantly increased rates in a determined effort to defeat inflation with little (or no) regard to the negative impact on economic growth. This happened in Canada in the early 1980s and the early 1990s; national home prices declined following a massive increase in the Bank of Canada (“BOC”) rate, as the central bank prioritized defeating inflation over a resultant recession[4].
With inflation currently below 2% for Canada and Australia, neither the BOC nor the Reserve Bank of Australia (“RBA”) faces a stark inflation/growth trade-off.
3. Recent softness in GDP alleviates pressure on central banks to raise rates
Although quarterly GDP reports can be volatile and subject to large revisions, the recent softness in economic growth (in Canada, Australia and globally) has reduced pressure on the BOC and RBA to raise rates[5]. With the BOC overnight lending rate at 1.75% and the RBA cash rate target at 1.50%, both central banks have some flexibility to lower rates should GDP growth soften further.
Should either central bank decide to reduce rates in a slowing economy, it would provide support to their housing market which could extend the cycle and increase the probability of an orderly rebalancing. This, in turn, would lessen the risk of an economically disruptive correction in home prices, a clear positive for Canadian and Australian banks given their dominance in their domestic mortgage markets.
4. Forecast GDP growth remains well above recessionary levels (especially Australia)
Current forecast GDP growth for Canada and Australia for the next two years remains well above recessionary levels providing a margin of safety to investors (see chart). In fact, Australia ranks near the top of the large developed economies, with forecast GDP growth of 2.3% in 2019 and 2.6% in 2020. Canada appears somewhat more vulnerable, with forecast GDP growth of 1.5% and 1.8% for 2019 and 2020[6], respectively.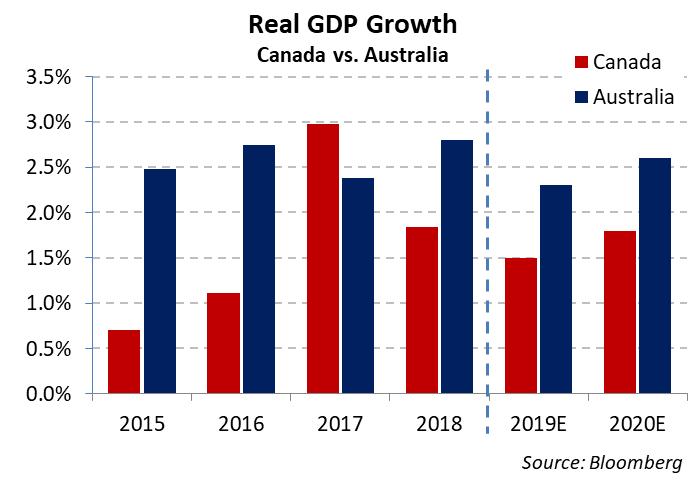
GDP growth forecasts are certainly susceptible to downward revisions. However, investors worried about a severe housing correction should take some comfort that the further forecast GDP is above zero, the greater the headwinds have to be to push either economy into a recession.
5. Unemployment remains low (reducing consumer credit risk)
During the Canadian housing corrections in the early 1980s and 1990s, unemployment was meaningfully higher than today. While recent quarterly GDP prints have been softer, this has not – so far – been accompanied by rising unemployment. In fact, unemployment is not only relatively low (5.6% in Canada; 5.0% in Australia), but it has been trending lower in both countries (see chart). Although this downward trend is not expected to continue, unemployment is forecast to remain stable at current levels through 2020[7].
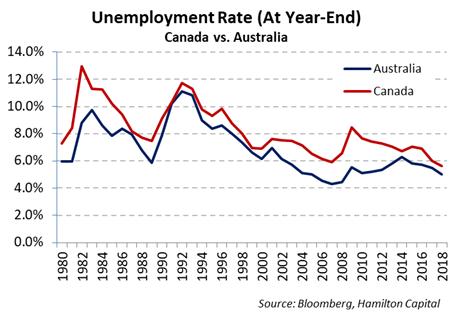 Continued strength in the labour markets is important to consumer credit (mortgages, unsecured loans, credit cards) since loan losses are positively correlated with unemployment rates[8]. It is also worth noting that borrowers tend to default on their mortgages last since the life consequences of foreclosure and eviction are vastly greater than defaulting on credit cards or unsecured personal loans. Therefore, as long as unemployment remains low, consumers should be better able to finance their mortgages, a positive for credit quality.
6. Policy makers are aggressively trying to prevent a disruptive housing correction
Policy makers, highly motivated to avoid a disruptive decline in home prices, have taken various policy steps in Canada and Australia to try to prevent a hard landing, albeit with a different emphasis. Canadian policy measures have been more focused on influencing mortgage demand, while Australian measures have concentrated more on strengthening the banking sector in the event of a correction.
In Canada, the recent federal budget included the unprecedented step of using the state-owned mortgage insurer (CMHC) to loan up to 10% of the new home value to first time home buyers. This highly unorthodox policy was implemented to enhance affordability and support the housing market, underscoring just how motivated the Canadian government is to avoid a disorderly decline in home prices. Canadian provinces have also taken steps aimed at influencing the market, including introducing taxes on non-resident buyers. Consistent with its “light touch” and pro-bank regulatory model, OSFI has NOT taken any meaningful steps to buttress the strength of the banks. Instead, OSFI appears to be relying on the sector’s sheer earnings power to shield it from housing tail risks[9].
In Australia, regulators concerned about housing risk have forced the banks in recent years to significantly increase their capital (overall and specifically on residential mortgages) making Australian banks among the best-capitalized globally (and holding ~40% higher capital than the Canadian banks). Regulators also placed caps on mortgages in higher risk categories with the objective of reducing portfolio risk over time (i.e., without disrupting the market).Leaving aside the wisdom or even efficacy of the measures proposed, the fact that policy makers retain significant levers to influence the market – and are willing to use them – is also a risk mitigant.
Ongoing Housing Correction Likely to Pose Modest Indirect vs. Severe Direct Risks to the Banks
Home prices in both Canada and Australia continue to decline, posing both direct and indirect risks to the banks. In our view, the most likely impact to the banks is indirect, in the form of softer GDP. Although this could be a headwind to revenue growth (from weaker loan growth and net interest income), this is arguably already reflected in Canadian and Australian bank valuations.
We do NOT foresee a large direct impact to the Australian and Canadian banks, namely a correction in home prices so rapid/severe that it causes (or is coincident with) a recession and a full-blown credit cycle. This is an important distinction since, given the huge size of these mortgage portfolios, even small increases in loss ratios could pose a threat to earnings.
Both countries’ banks have high(er) and sustainable dividend yields providing a reliable base for returns. These characteristics, combined with their excellent long-term performance histories, invariably attract buyers when share prices fall (and dividend yields rise) making shorting these banks expensive.
While the housing story has not yet been fully written, we believe the ongoing corrections will remain orderly and that a big housing short position in the Canadian and Australian banks will continue to be challenging. Our rules-based Hamilton Capital Canadian Bank Variable-Weight ETF (HCB) and our actively-managed Hamilton Capital Australian Financials Yield ETF (HFA) offer monthly income from two world-class financial sectors trading at valuations notably lower than their historical averages, reflecting many risks – including housing.
Related Insights
Australian Financials: Regulatory Clarity Arrives – February 5, 2019
Dividend-Heavy Australian Financials: History of Outperformance vs. Canadian Peers – December 17, 2018
Australian Banks Outperformed the Canadian Banks during the Financial Crisis – December 17, 2018
Pref ETFs Falter (Again): Why HCB/HFA are Logical Switch Candidates for Monthly Income – December 17, 2018
Canadian Banks: Mean-Reversion Strategy for Higher Returns/Lower Risk – September 27, 2018
Notes
[1] HCB is a rules-based ETF that rebalances the portfolio of the top 6 Canadian banks at the end of each month, weighting the three most ‘oversold’ banks to ~80% and the three most ‘overbought’ banks to ~20%.
[2] Sub-advised by Horizons ETFs’ “The Options Guys”.
[3] Includes the 2008/2009 recent financial crisis, during which the Australian banks outperformed Canadian banks.
[4] Between 1981 and 1982, Canadian home prices declined by ~9% nationally following a 1,000+ bps increase in the BOC rate (between 1978 and 1981). Canadian home prices also declined 9% between 1989 and 1990 following a 600+ bps increase in the BOC rate between 1987 and 1990. In both cases, central bank action to defeat/tame economically damaging levels of inflation did in fact precipitate recessions, with negative GDP growth in 1982 (-3.0%) and 1991 (-2.1%). In Australia, home prices were stable or experienced modest declines in the early 1980s and 1990s. Source: Bank of International Settlements, Bloomberg.
[5] Q4 2018 GDP for Canada and Australia were 0.1% (0.4% annualized) and 0.2% (0.7% annualized), respectively. This was down from 0.5% (2.0% annualized) and 0.3% (1.0% annualized). Quarterly real GDP is seasonally adjusted. Source: Statistics Canada, Australian Bureau of Statistics.
[6] Source: Bloomberg. As of April 5, 2019.
[7] As of April 5, 2019, unemployment is forecast to be in the 4.9% to 5.1% range for 2019 and 2020 for Australia. In Canada, unemployment is forecast to be in the 5.8% to 5.9% range through 2019 and 2020. Source: Bloomberg.
[8] In other words, consumer loan defaults rise when more people are unemployed.
[9] OSFI did introduce a “stress test” on mortgage underwriting. However, the banks already engaged in extensive stress testing of their mortgage portfolios.”
Note: Comments, charts and opinions offered in this commentary are produced by Hamilton Capital and are for information purposes only. They should not be considered as advice to purchase or to sell mentioned sec