

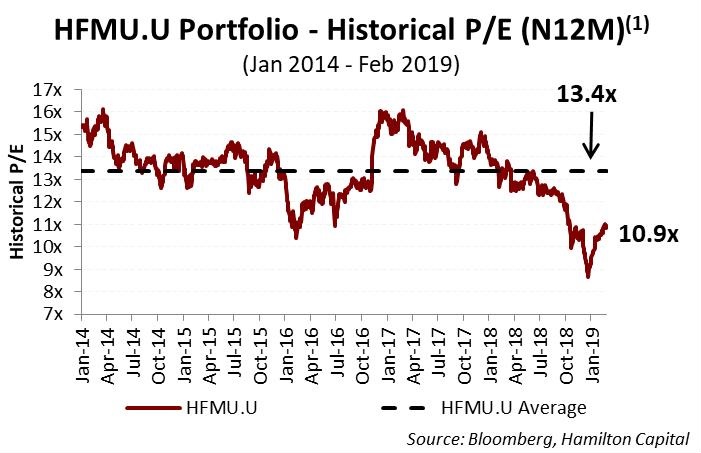
At present, the actively-managed Hamilton Capital U.S. Mid-Cap Financials ETF (USD) (ticker, HFMU.U), represents superior value versus a portfolio of the largest U.S. banks, namely Bank of America, JPMorgan, Citigroup, and Wells Fargo. As the chart below highlights, the portfolio-weighted price-to-earnings (P/E) ratio for HFMU.U is now at a 2.5x discount to its 5 year average, which is meaningfully larger than the 0.9x discount of the four U.S. mega-cap banks. HFMU.U would have to rise 23% for its portfolio-weighted P/E to return to its 5 year average, a valuation level it has traded above for more than half of that period.
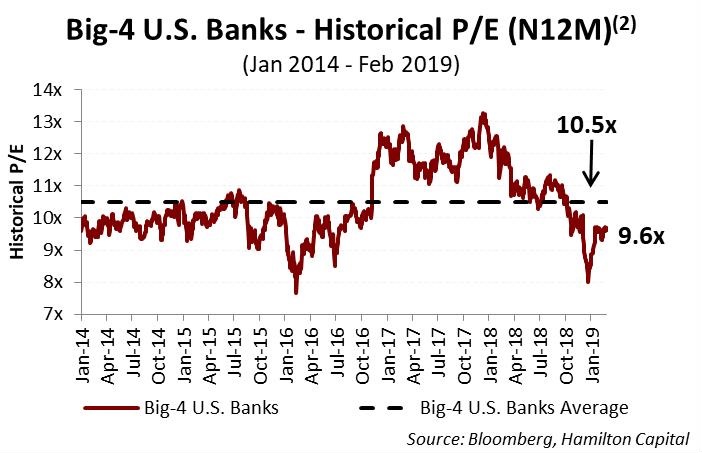
By contrast, the four U.S. mega-cap banks (BAC, JPM, C and WFC) would have to rise 9% to return to their five year average[1]. Interestingly, these four mega-cap banks have spent more than 60% of their trading days in the last 5 years trading below this average, implying mean reversion could be more difficult and/or slower.
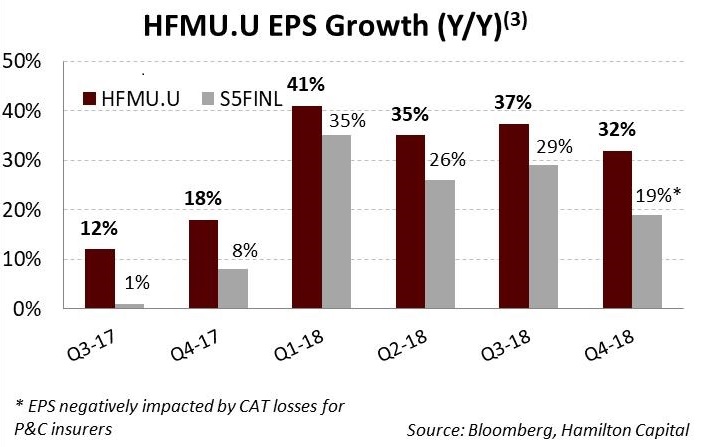
Importantly, this divergence and wider discount is not related to the fundamentals of HFMU.U. As the chart below highlights, since it was launched, the holdings of HFMU.U have generated materially higher portfolio-weighted EPS growth than the U.S. large-cap financials index (of which the four mega banks are over ~30%) each and every quarter since inception (note, the reduction in corporate tax rates added ~18% to 2018 results).
Therefore, we continue to favour the U.S. mid-cap financials over their large-cap peers for their: (i) higher forecast EPS growth, (ii) discounted valuations (relative to history), (iii) targeted exposure to higher growth states and metropolitan areas, including the southeast and southwest regions, (iv) favourable regulatory trends, and (v) potential for accelerating consolidation/M&A activity.
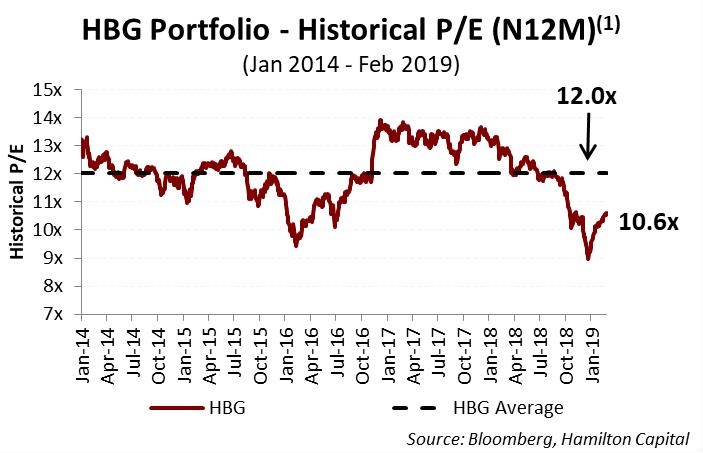
With over 45% of its holdings in U.S. mid-cap banks, the Hamilton Capital Global Bank ETF (HBG) shares a similar valuation discount to HFMU.U. It currently trades at a 1.5x multiple point discount to its 5 year average price-to-earnings multiple. HBG would have to rise 13% for its valuation to return to its five year average.
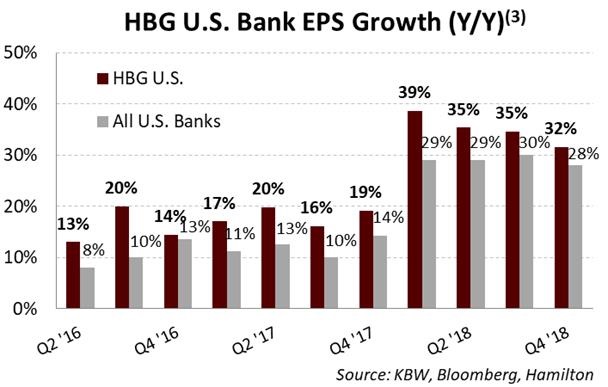
And as the chart below highlights, the U.S. bank portfolio within HBG has had higher EPS growth than the U.S. banking sector each and every quarter since it was launched over 3 years ago.
Notes
[1] Portfolio weights as of February 28, 2019
[2] Assuming an portfolio of the four banks, BAC, JPM, C, WFC, equally-weighted
[3] Portfolio-weighted
Note: Comments, charts and opinions offered in this commentary are produced by Hamilton Capital and are for information purposes only. They should not be considered as advice to purchase or to sell mentioned sec