

Since Hamilton U.S. Mid-Cap Financials ETF (USD) (ticker: HFMU.U) was launched in September 2017, the yield curve has flattened. Some market participants have taken this broader market signal to be an accurate predictor of a recession and by extension a credit cycle for banks. However, those interpreting the flattening of the yield curve (spread between the yield on the US 10 year and the Fed funds rate) as a harbinger of rapid deterioration of fundamentals and/or a credit cycle have experienced a false signal.
Note to Reader: This Insight includes references to certain Hamilton ETFs that were active at the time of writing. On June 29, 2020, the following mergers took place: (i) Hamilton Global Financials Yield ETF and Hamilton Global Bank ETF into the Hamilton Global Financials ETF (HFG), (ii) Hamilton Australian Financials Yield ETF into the Hamilton Australian Bank Equal-Weight Index ETF (HBA); (iii) Hamilton Canadian Bank Variable-Weight ETF into the Hamilton Canadian Bank Mean Reversion Index ETF (HCA), and (iv) Hamilton U.S. Mid-Cap Financials ETF (USD) into the Hamilton U.S. Mid/Small-Cap Financials ETF (HUM).
In fact, aided by a rising Fed funds rate from 2016 through to late 2018 – which has contributed to the flattening of the yield curve – EPS growth for the financial sector has been robust, particularly for interest rate sensitive mid-cap financials. Even with the most recent decline in the Fed funds rate and additional flattening, EPS growth has remained very strong.
In fact, since HFMU.U was launched, its holdings have generated portfolio-weighted EPS growth of between 10% and 20% (excluding the benefit of the tax reduction in 2018) and have outgrown the large-cap financials every quarter. Despite very strong fundamental performance supported by exposure to some of the fastest growing markets in the U.S., the holdings of HFMU.U trade at a ~20% discount to their five-year P/E average.
In Q3, Strong Fundamental Performance (Again)
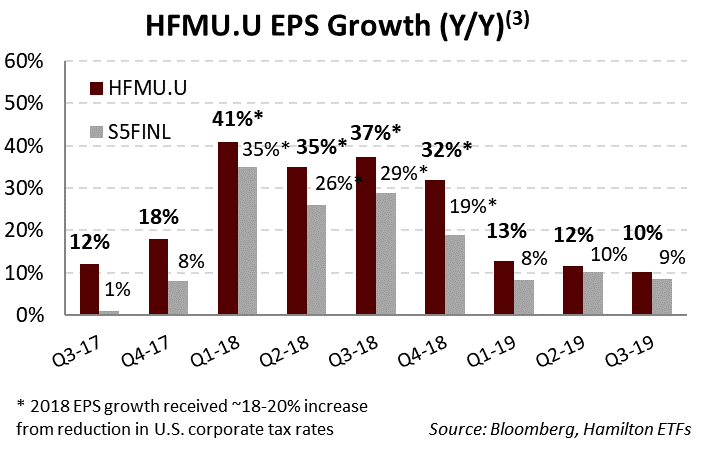
This quarter was another example of sound fundamentals and strong earnings growth across the portfolio holdings. In Q3 2019, the holdings of HFMU.U reported portfolio-weighted EPS[1] growth of 10.1%, or over 150 bps ahead of the large cap financials at 8.6%[2].
The superior earnings growth was driven by steady revenue trends (fee income aided by strong mortgage originations), a benign credit environment, and an emphasis on higher growth U.S. states and MSAs. While bank margins declined during the quarter, they are expected to stabilize as funding costs decline to match lower policy rates. The low rate environment was beneficial to fee income and volume growth at the mortgage lenders and insurers in HFMU.U (~8% weight). For the overall portfolio, as it has across most quarters in the past, earnings exceeded consensus expectations.
Within HFMU.U, the U.S. mid-cap bank holdings remain a key earnings growth driver (~65% weight). Earnings growth for mid-cap banks at 9.0% outpaced the regionals/trusts by well over 500 bps. HFMU.U’s wealth management and insurance positions grew EPS by ~7% and 16% y/y respectively (versus ~9% and 10% growth for large-cap wealth managers and insurers respectively).
As the chart below highlights, portfolio-weighted EPS growth for HFMU.U has grown faster than for the large-cap financials every quarter since inception (2018 EPS growth benefitted from the U.S. tax cuts – which added an additional ~18%-20% to EPS growth).
HFMU’s higher EPS growth in the quarter was driven by stock selection and sub-sector allocation with an emphasis on: (i) overweighting mid-cap banks, insurers and wealth managers with interest rate and operating levers, (ii) MSA/states with higher population and economic growth , and less significantly, (iii) ongoing industry consolidation. Against the backdrop of a stable U.S. economic expansion and healthy industry fundamentals, we believe consolidation in the financial services sector is poised to accelerate across all financial sub-sectors, including banking (see U.S. Bank M&A: Another Accretive MOE, Another Positive Market Reaction).
We continue to believe that investors seeking exposure to the U.S. financials sector should allocate a material component to U.S. mid-caps given: (i) the mid-caps strong historical performance relative to the large-caps (including/especially through the financial crisis), (ii) lower correlations to the large-caps (providing diversification), (iii) opportunity for stock selection, including geographic customization, (iv) exposure to ongoing consolidation, and (v) a more favourable regulatory backdrop.
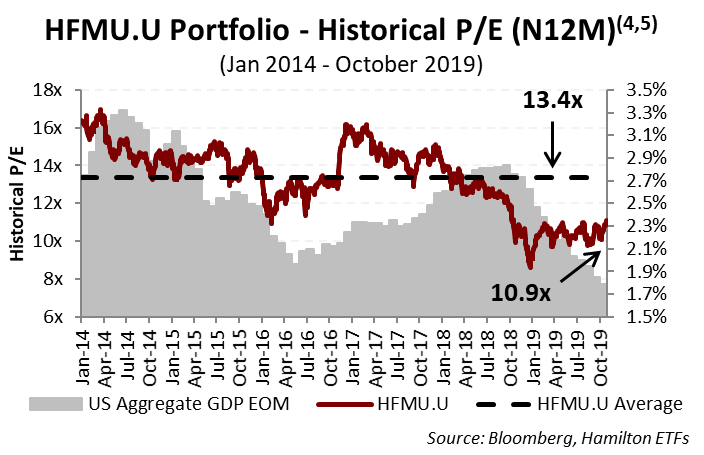
Moreover, U.S. mid-cap financials continue to trade at significant valuation discounts to their long-term average, offering the potential for multiple expansion. As the chart below highlights, the current holdings of HFMU.U trade at 10.9x, a ~20% discount to their five-year average.
A word on trading liquidity for ETFs …
HFMU.U is a highly liquid ETF that can be purchased and sold easily. ETFs are as liquid as their underlying holdings and the underlying holdings in HFMU.U trade millions of shares each day.
How does that work? When ETF investors are buying (or selling) in the market, they may transact with another ETF investor or a market maker for the ETF. At all times, even if daily volume appears low, there is a market maker – typically a large bank-owned investment dealer – willing to fill the other side of the ETF order (at net asset value plus a spread). The market maker then subscribes to create or redeem units in the ETF from the ETF manager (e.g., Hamilton ETFs), who purchases or sells the underlying holdings for the ETF.
Notes
[1] ~90% of HFMU holdings had reported as of November 4, 2019; assumes remaining holdings report EPS equal to consensus
[2] The U.S. financials are those represented by the S&P Financials Selector Sector Index, the S5FINL Index (ex-Berkshire). We exclude Berkshire Hathaway because its large quarterly investment gain/loss creates significant variability that disproportionately impacts the earnings growth of S5FINL (both positively and negatively). Earnings growth for each position is calculated using most recent quarterly adjusted EPS (or FFO) divided by the prior year’s quarterly adjusted EPS (or FFO), capped at +/- 100%.
[3] Portfolio-weighted average.
[4] Portfolio weights as of October 31, 2019.
[5] GDP data is a blended forward 12 month forecast of quarterly estimates. Data prior to October 31, 2014 uses actual GDP growth (versus market forecast).