

The U.S. financials have been showing strong momentum this year outperforming the S&P 500[1], fueled by increased economic optimism and investor sentiment. The Hamilton U.S. Mid-Cap Financials ETF (HUM) has been the top performing U.S. financials/ banks ETFs in Canada since inception (see below). That said, following earnings season, the large-cap financials, which typically set the tone for the rest of the sector, are leading the way up 13.27% YTD, while the mid-caps are up 7.38%[2] – creating an opportunity for investors (especially those overweight U.S. large-cap banks). Provided the U.S. economy continues its healthy performance, we believe there is a strong argument for investors to consider reducing some large-cap financial exposure in favour of the Hamilton U.S. Mid-Cap Financials ETF (HUM), given the U.S. mid-cap financials offer considerable upside potential from their: (i) attractive relative valuations, (ii) higher earnings estimates, and (iii) long-term history of outperformance vs. the U.S. large-cap financials.
HUM: Top Performing U.S. Financials ETF in Canada
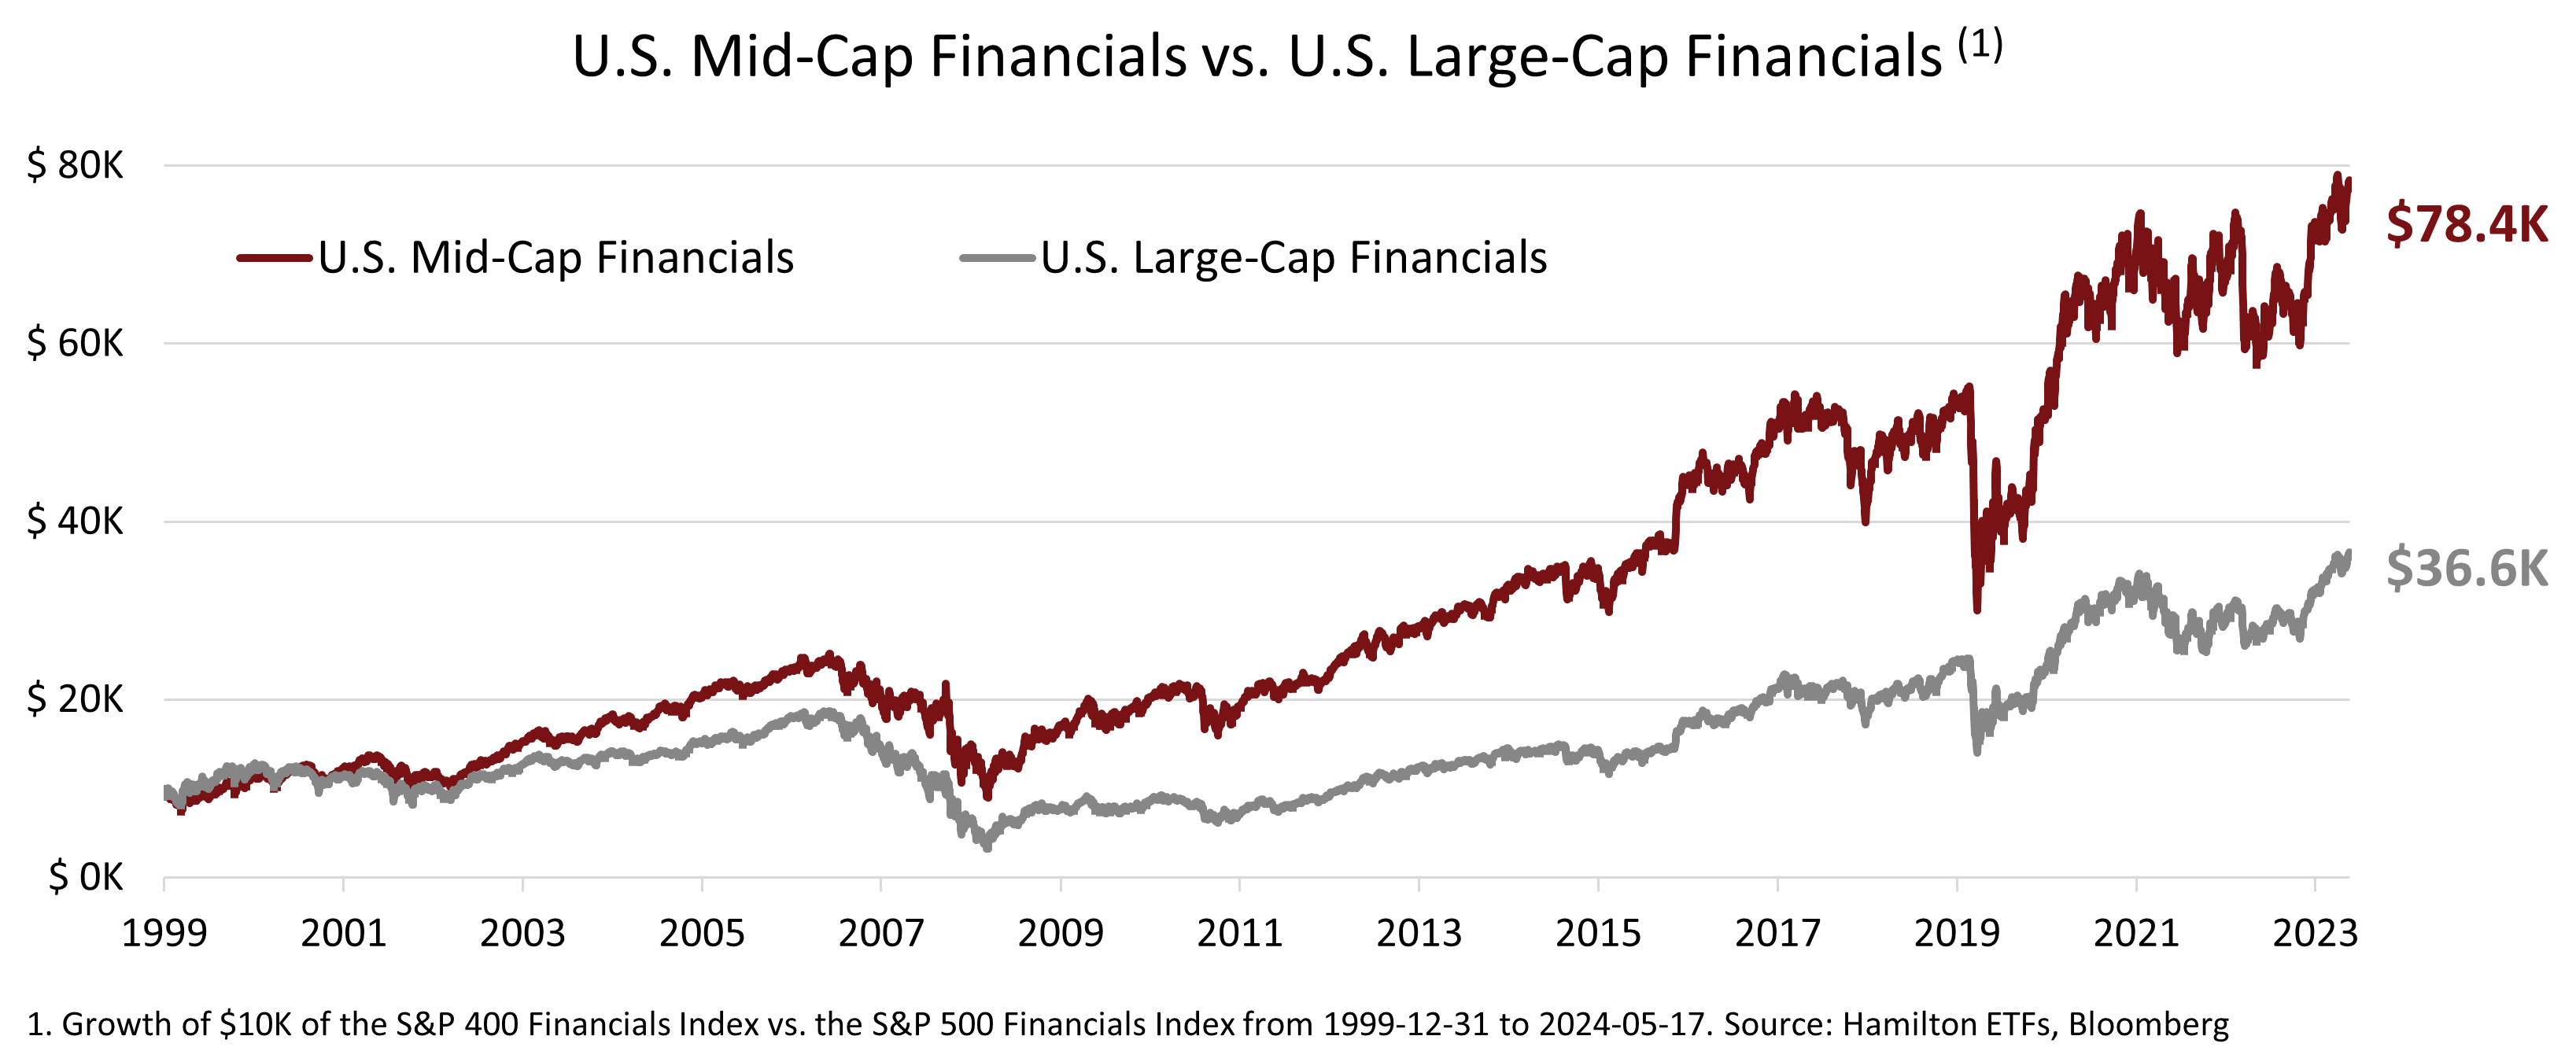
As the top performing U.S. financials ETF in Canada with an annualized return of 18.45% since inception[3], the Hamilton U.S. Mid-Cap Financials ETF (HUM) provides investors with diversification, active management, and exposure to higher growth regions in the U.S. with M&A potential. Historically, U.S. mid-cap financials have been one of the best performing categories in global financials, materially outperforming the large-caps over the last 20+ years.
Closing the Gap — U.S. Mid-Cap Financials Trading Below 10-Year Averages
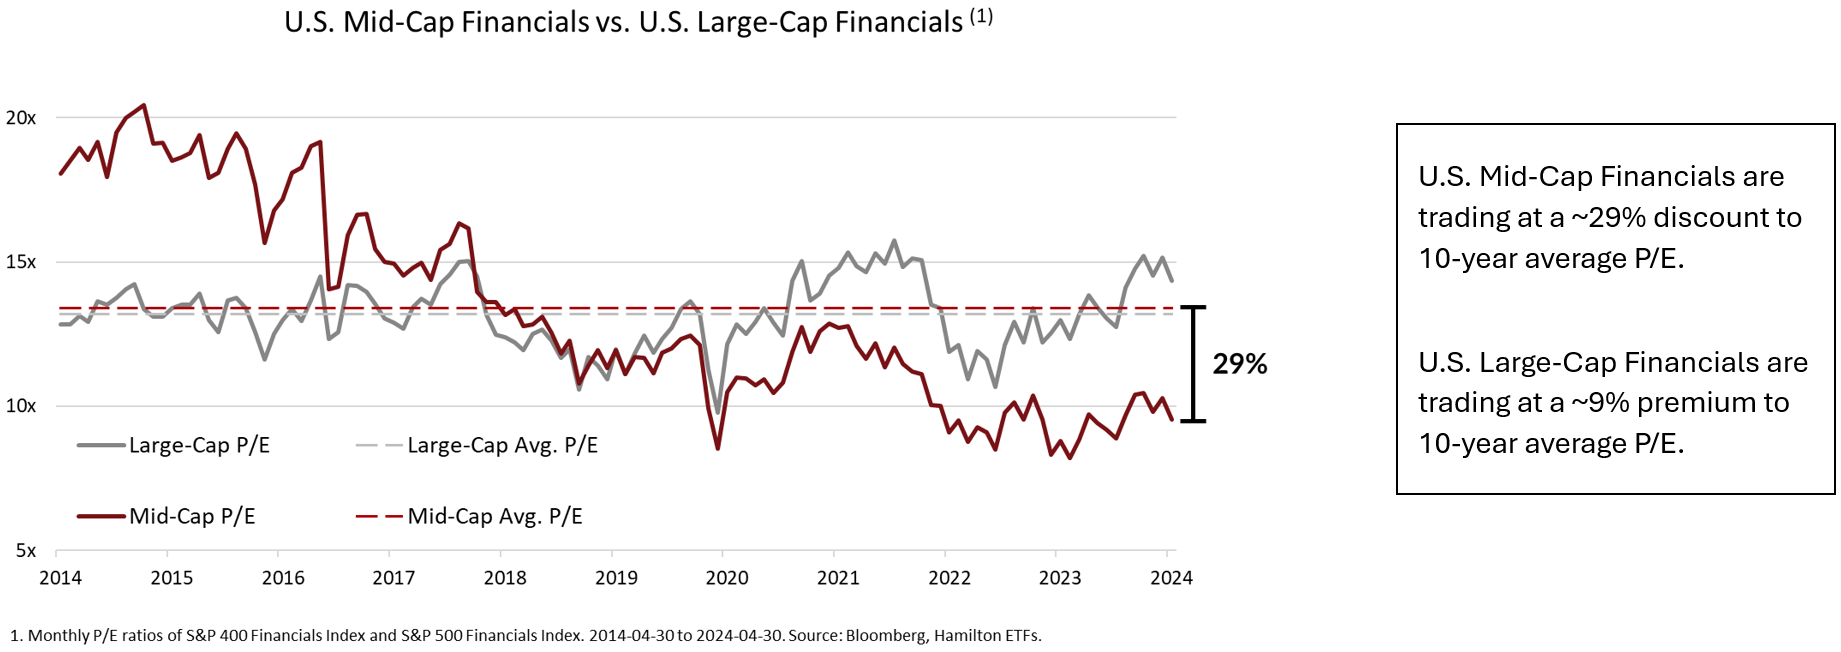
The U.S. mid-cap financials are inexpensive on both an absolute and relative basis, suggesting significant upside potential in the form of multiple expansion provided investor sentiment and the economy continue to improve. On price-to-earnings (P/E), the U.S. mid-map financials are trading, on average, at 9.5x 2025 earnings, which is ~29% below their 10-year average of 13.4x. Interestingly, the U.S. mid-cap financials are also inexpensive relative to the U.S. large-caps, which are trading at 14.3x next year’s earnings or ~9% above their 10-year average P/E of 13.2x.
Despite the historical outperformance of the U.S. mid-cap financials relative to the large-caps, they are currently lagging for two main reasons in our view:
- concerns on commercial real estate (“CRE”) exposure, and
- earnings uncertainty.
Below, we outline how we are managing these concerns within HUM and why these risks seem to be declining.
CRE has seen its value decline with higher interest rates, and for offices, the trend toward working from home. While it is true that CRE is a concern for banks (especially for small and mid-cap banks that have greater exposure to such loans), there are reasons to believe that this should be a manageable issue for HUM in our view.
- HUM is diversified and invests in all sub-sectors of the U.S. financial sector with banks currently representing ~50%. We continue to review the banks in the portfolio to reduce the risk from CRE and avoid companies whose capital levels or CRE exposures place them at greater risk.
- Banks generally have several areas of defence against credit losses, specifically: earnings, capital, and loan loss reserves. Currently, the banks we own in HUM have strong earnings, high capital levels, and loan loss reserves well in excess of net charge-offs. While these metrics speak to the quantitative strengths of banks, we are focused on banks whose management has proven, over time and economic cycles, to be excellent stewards of their shareholders’ capital and deal with risk proactively and conservatively.
2023 was a difficult year for mid-cap financials with earnings estimates gradually falling throughout the year, whereas the large-cap financials’ estimates held firm after an initial pullback in March. Despite these challenges, HUM was up 14.4% in 2023, while large-cap and mid-cap financials were up 9.4% and 5.5%[4], respectively. The outperformance of HUM resulted from its active management and diversification, namely strong performance in the insurance and other non-bank sub-sectors coupled with strong relative performance from its banking sector positions. Still, the pullback in earnings during 2023 has left investors questioning analysts’ estimates for 2024.
Favourable Relative Valuations vs Large-Caps plus Brightening Earnings Outlook Creates Opportunity (for HUM)
Investors are currently taking a wait-and-see approach to forward earnings for the sector. However, this is where the opportunity lies, in our opinion, as forward earnings estimates are much higher for the U.S. mid-cap financials over the next two years (28% vs. 12% for the U.S. large-cap financials[5]). Moreover, the earnings outlook for the mid-caps and HUM looks appealing, especially considering their attractive valuations.
We believe the earnings growth gap relates largely to projected net interest margins (NIMs) within the banking sector. When higher interest rates and the regional banking strife of 2023 pushed depositors to seek other places for their money, large-cap banks benefitted from a flight to safety influx of low-cost deposits. With the benefit of time and a more stable environment, mid-cap banks are finding cheaper alternatives and repricing loans higher to reflect the higher costs of funds. With mid-cap bank profitability much more dependent on lending, changes in NIMs are significantly more impactful for them. Now, analysts are forecasting some of the decreases in NIMs to unwind in mid-2024 through 2025, providing a tailwind for earnings. Large-cap banks on the other hand, which did not see their NIMs contract as much, are unlikely to enjoy this tailwind to the same extent.
Trade Idea: Reduce U.S. Large-cap Financials in favour of HUM
Provided the U.S. economy remains healthy, we believe there is a compelling case for reducing some large-cap exposure in favour of the mid-caps, whose valuations could close the gap and deliver strong returns. We believe the Hamilton U.S. Mid-Cap Financials ETF (HUM) is well positioned to benefit from the potential continued economic strength and improved sentiment towards the sector. We continue to focus on higher growth regions within the U.S. and companies with experienced management teams that have demonstrated the ability to grow earnings robustly over the business cycle. In the meantime, we believe the sector presents an attractive buying opportunity with inexpensive valuations and considerable recovery potential.
For more commentary, subscribe to our Insights.
Recent Insights
The Case for Australian Banks in Canadian Portfolios | May 3, 2024
HFG — The Secret Bull Market in Global Financials | April 22, 2024
Replay: Market Outlook with Ed Yardeni — Roaring 20s Still Ahead? | April 18, 2024
Canadian Banks: Buying Opportunity? (BNN Video) | February 27, 2024
BMO/BNS Q1 2024 Takeaways (BNN Video) | February 27, 2024
____
A word on trading liquidity for ETFs …
Hamilton ETFs are highly liquid ETFs that can be purchased and sold easily. ETFs are as liquid as their underlying holdings and the underlying holdings trade millions of shares each day.
How does that work? When ETF investors are buying (or selling) in the market, they may transact with another ETF investor or a market maker for the ETF. At all times, even if daily volume appears low, there is a market maker – typically a large bank-owned investment dealer – willing to fill the other side of the ETF order (at net asset value plus a spread). The market maker then subscribes to create or redeem units in the ETF from the ETF manager (e.g., Hamilton ETFs), who purchases or sells the underlying holdings for the ETF.
[1] Total return of 13.27% for the S&P 500 Financials Index (S5FINL), and 11.80% for the S&P 500 Total Return Index (SPXT). From December 29, 2023, to May 17, 2024.
[2] Total return of the S&P 500 Financials Index (S5FINL) vs. the S&P 400 Financials Index (S4FINL). From December 29, 2023, to May 17, 2024.
[3] Since inception on June 26, 2020, as at April 30, 2024. Based on a universe of eight U.S. financials ETFs that trade on the Toronto Stock Exchange.
[4] Total return for calendar year 2023. In CAD terms. As measured by the S&P 500 Financials Index (S5FINL) for the “large-cap financials” and the S&P 400 Financials Index (S4FINL) for the “mid-cap financials”.
[5] As of May 17, 2024
Commissions, management fees and expenses all may be associated with investments in exchange traded funds (ETFs) managed by Hamilton ETFs. Please read the prospectus before investing. Indicated rates of return are the historical annual compounded total returns including changes in per unit value and reinvestment of all dividends or distributions and does not take into account sales, redemptions, distribution or optional charges or income taxes payable by any securityholder that would have reduced returns. Only the returns for periods of one year or greater are annualized returns. ETFs are not guaranteed, their values change frequently and past performance may not be repeated.
Certain statements contained in this website may constitute forward-looking information within the meaning of Canadian securities laws. Forward-looking information may relate to a future outlook and anticipated distributions, events or results and may include statements regarding future financial performance. In some cases, forward-looking information can be identified by terms such as “may”, “will”, “should”, “expect”, “anticipate”, “believe”, “intend” or other similar expressions concerning matters that are not historical facts. Actual results may vary from such forward-looking information. Hamilton ETFs undertakes no obligation to update publicly or otherwise revise any forward-looking statement whether as a result of new information, future events or other such factors which affect this information, except as required by law.