

At the end of August, the S&P/TSX Canadian Diversified Bank Total Return Index (“Canadian bank index”) was lower versus two years earlier – a rare event. In fact, since its inception in May 2002, the Canadian bank index has had a negative rolling two-year return at just 24 month-ends (out of 232 month-ends)[1]. Historically, such an occurrence has represented a buying opportunity.
Over the same 20+ year period, only once did the banks not have a positive return in the twelve months following a negative two-year return. This positive historical indicator makes for an interesting juxtaposition to the negative sentiment reflected in the banks’ very low current valuations. In this Insight, we examine this positive historical indicator and what it might imply for Canadian bank stocks in the next year.
NOW TRADING: Before we discuss the Canadian banks, we would like to highlight the launch of Canada’s first fixed income covered call ETF – the Hamilton U.S. Bond Yield Maximizer ETF, which began trading on September 15th under the ticker HBND. The objective of HBND is to provide investors with exposure primarily to U.S. treasuries. To enhance the yield and reduce volatility, HBND employs an actively managed covered call writing strategy. The initial target yield is 10%+[2].
Back to the banks.
History of Positive Returns Following Rolling Negative Two-Years Returns … BUT …
We reviewed the historical data to see how often Canadian banks had negative two-year returns and measured the performance of the Canadian bank index in the following twelve months. The chart below shows the two-year returns of the Canadian bank index at month-ends since its inception in May 2002, which highlights several important takeaways[3].

First, negative two-year return periods are clustered around two global macro events – the Global Financial Crisis (GFC) and COVID. Both events triggered rapid and severe corrections and sustained periods of negative two-year returns (14 and 8 months, respectively). Second, excluding the GFC and COVID, until this year (May and August 2023), there have been no other negative rolling two-year return periods – not one.
Third, the sector managed to generate positive two-year returns through other challenging periods for bank stocks, including the European Sovereign Debt Crisis (2011), Brexit (2016) and recession concerns and yield curve inversion (2018). Fourth, and most importantly, the two most recent negative months – May and August 2023 – stand out as unusual because their negative returns are modest, and not closely tied to a severe global macro event.
… Not all Down Periods – or Recoveries – are Created Equal
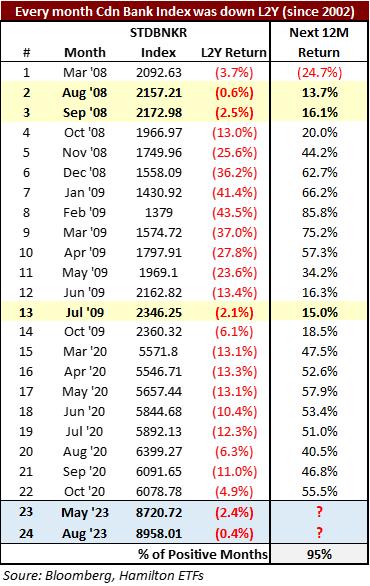
When thinking of the current environment, it is important to emphasize that not all down periods, or recoveries are the same. Looking at the appendix (at the bottom of this Insight), the more negative the two-year return, generally, the more powerful the recovery in the following twelve months. Notably, May and August 2023 were the first instances of two-year negative returns not related to the GFC/COVID, with relatively modest declines of ↓2.4% as of May and ↓0.4% as of August. There are only 3 other instances in the last 20+ years where the negative two-year return was less than 3%: August 2008, September 2008, and July 2009. The average subsequent 12-month return for those three period ends was much lower than the average (of over 40%), but a still very healthy 15%.
History Favours the Canadian Banks Over the Next Twelve Months
While past results are not a guarantee of future returns, history would suggest the negative two-year return at the end of August represents a positive signal to bank investors. In the past two decades, this has happened in less than 10% of months and the banks bounced back in the next 12 months, posting double digit returns each time – except one (March 2008).
Current valuations are low at 9.2x f2024 earnings and just 8.9x f2025[4], and in our view, already reflect a lot of bad news. The sector appears well positioned to deal with this challenging environment given: (i) the rate cycle appears to be well advanced, (ii) balance sheets are very strong and (iii) consensus f2024 earnings estimates incorporate an increase in loan losses of ~35% year-over-year. We continue to believe the sector represents a favourable risk reward for long-term investors.
Hamilton ETFs is the #2 provider of Canadian bank ETFs, accounting for over $1 bln of the firm’s ~$2.9 bln in AUM. Investors seeking exposure to the Canadian banks might consider: i) the Hamilton Enhanced Canadian Bank ETF (HCAL); (ii) the Hamilton Canadian Bank Equal-Weight Index ETF (HEB); and/or (iii) the Hamilton Canadian Bank Mean Reversion Index ETF (HCA). For those looking for broader exposure to the Canadian financial sector, they might consider our Hamilton Enhanced Canadian Financials ETF (HFIN), and/or Hamilton Canadian Financials Yield Maximizer ETF (HMAX).
| ETF | Ticker | Indicated Yield
(paid monthly)[5] |
Style | Sector Exposure |
| Hamilton Enhanced Canadian Bank ETF | HCAL | 8.08% | Growth (25% leverage) + income | Canadian banks |
| Hamilton Canadian Bank Equal-Weight Index ETF | HEB | 5.44% | Growth + income; lower fee | Canadian banks |
| Hamilton Canadian Bank Mean Reversion Index ETF | HCA | 5.86% | Growth + income; overweights banks that are oversold | Canadian banks |
| Hamilton Enhanced Canadian Financials ETF | HFIN | 6.78% | Growth (25% leverage) + income | Canadian financials |
| Hamilton Canadian Financials Yield Maximizer ETF | HMAX | 15.50% | Income/covered call | Canadian financials |
Appendix: Historical Monthly Periods of Negative Two-Year Returns and Next Twelve Months
Recent Insights
Canadian Banks: Three Ways the Banks Might “Clean Up” fQ4 (and Improve f2024) | September 14, 2023
Video: Canadian Banks – Weathering the Storm | June 8, 2023
Video: Market Outlook with Ed Yardeni | May 16, 2023
Video: Canadian Banks – What’s Next? | April 11, 2023
Canadian Banks: Opportunities and Risks in 2023 | January 23, 2023
____
A word on trading liquidity for ETFs …
Hamilton ETFs are highly liquid ETFs that can be purchased and sold easily. ETFs are as liquid as their underlying holdings and the underlying holdings trade millions of shares each day.
How does that work? When ETF investors are buying (or selling) in the market, they may transact with another ETF investor or a market maker for the ETF. At all times, even if daily volume appears low, there is a market maker – typically a large bank-owned investment dealer – willing to fill the other side of the ETF order (at the bid/ask spread).
Commissions, management fees and expenses all may be associated with an investment in the ETFs. The relevant prospectus contains important detailed information about each ETF. Please read the relevant prospectus before investing. The ETFs are not guaranteed, their values change frequently and past performance may not be repeated.
Certain statements contained in this insight constitute forward-looking information within the meaning of Canadian securities laws. Forward-looking information may relate to a future outlook and anticipated distributions, events or results and may include statements regarding future financial performance. In some cases, forward-looking information can be identified by terms such as “may”, “will”, “should”, “expect”, “anticipate”, “believe”, “intend” or other similar expressions concerning matters that are not historical facts. Actual results may vary from such forward-looking information. Hamilton ETFs undertakes no obligation to update publicly or otherwise revise any forward-looking statement whether as a result of new information, future events or other such factors which affect this information, except as required by law.
[1] May 2002 to August 2023. Source: Bloomberg
[2] An estimate of the annualized yield an investor would receive if the distribution remained unchanged for the next 12 months, stated as a percentage of the net asset value per unit on September 14, 2023.
[3] Chart begins May 2004, two years after the first month the index was launched.
[4] Average of big-6; Source: Bloomberg
[5] An estimate of the annualized yield an investor would receive if the monthly distribution remained unchanged for the next 12 months, stated as a percentage of the net asset value per unit on August 31, 2023.