

Note to Reader: We are pleased to announce the launch of the Hamilton Enhanced Canadian Bank ETF (HCAL), which began trading on the TSX on Thursday, October 15th and has a current yield of ~6.5%. HCAL invests 125% of NAV into the Hamilton Canadian Bank Mean Reversion ETF (HCA) using cash borrowed from a Canadian financial institution. The underlying – and unlevered – HCA seeks to replicate the returns, net of fees and expenses, of the Solactive Canadian Bank Mean Reversion Index, which has generated material outperformance versus equal weight Canadian bank portfolios and indices over the past thirty years[1].
The Canadian banks will report fQ4 results in early December. This quarter will be the third of the COVID credit cycle. This severe cycle, which began in February, was caused by the immediate drop in GDP and rise in unemployment and has weighed on bank results and stock prices. In fQ2 and fQ3, the Canadian banks recorded nearly $18 bln in loan losses (or ~3x “normal”[2]), causing earnings to decline by ~50% in Q2 before rebounding to about 80% of “normal”[3] .
Most of the allowances built up were against performing loans, as banks prepared for a wave of defaults next year. One interesting characteristic of this credit cycle is that government support programs (including direct fiscal transfers) and widespread loan deferrals have – so far – averted a substantial rise in “bad loans”[4]. Once those deferrals and support programs begin to recede, defaults will inevitably rise. But the 2018 change in loan loss accounting has meant the banks have been preparing in advance.
Two possible tools in Q4 to “clear the decks” for 2021
As mentioned, the banks report Q4 in early December, which will be the third quarter of this credit cycle. To further build defences against rising bad loans in 2021 and to accelerate the return to normalized earnings, the Canadian banks, we believe, will likely use Q4 as a “clean-up” quarter, which might include two important tools that could place the banks in a stronger position heading into next year.
Tool #1: Higher loan losses to further build allowances against performing loans
As of the most recent quarter (i.e., fQ3), the banks had built $23.5 bln of allowances against loans that are still “performing” (i.e., have not yet defaulted)[5]. These allowances will be used to absorb losses from loans that default due to any number of factors, including end of payment deferrals, declining fiscal transfers, and/or slower recovery, particularly in certain sectors. The $23.5 bln is a huge number and, to put it into perspective, it represents nearly two years of “normal” credit losses. However, in our view, the banks could seek to build this cushion by $2 to $3 bln citing the risk of a possible second wave and heightened risk of delayed re-openings as a pretext.
This would result in higher loan losses and lower earnings versus the prior quarter. If that were to occur, the banks could conceivably enter next year with over $25 bln of reserves against performing loans to draw down against looming defaults.
Tool #2: Restructuring charges to pull-forward expenses
The next few years could present additional bank profitability challenges. Revenue growth could be challenging should the economic recovery be sluggish and weigh on business activity and loan volumes, while the decline in interest rates could place downward pressure on net interest margins (in absence of re-pricing). As a result, the banks will, in our view, face hurdles to generate positive operating leverage, and so, we expect the pressure to reduce expenses will intensify coming out of this cycle. This increases the probability the banks report restructuring charges, a tool they now regularly employ to show lower growth “core” expenses.
The effect of booking one-time charges like severance and asset write-downs is to pull forward expenses, thereby reducing reported earnings in the current quarter, but also increase earnings and improving operating leverage in future years.
Benefits of clearing the deck? Accelerated return to normalized earnings
Over the past several decades, the Canadian banks have routinely used Q4 as a clean-up quarter. By taking the opportunity to book one-time expenses and pull forward credit losses, they set the stage for higher earnings in the following year(s).
In our view, as long as the banks maintain satisfactory capital ratios, a Q4 clean-up could be seen as a positive by the markets as it would accelerate the return to normalized earnings (lower loan losses, lower expenses) as well as improve visibility. However, we do not expect management teams to give any clear EPS guidance for next year, which could temper the markets reaction.
Why have Canadian bank stocks not fully recovered – yet?
As of October 22, the Canadian banks were down ~10% year-to-date and ~13% from their February highs[6]. In our view, the biggest barrier to a full recovery in stock prices is the uncertainty regarding when the sector will return to normalized earnings. Should the banks report a Q4 clean-up quarter, we believe this would likely be viewed positively by the markets for two reasons:
- the market could conclude that the ~$23 to $25 bln set aside against performing loans is sufficient to cover upcoming losses and
- this will accelerate the return to normalized quarterly earnings of over $12 bln. We believe the banks will achieve this level of quarterly earnings level in 2021, and if correct, would facilitate a recovery in stock prices.
Two innovative Canadian bank ETFs to consider for investors seeking to add exposure
For investors that consider a recovery in Canadian bank stocks likely, we encourage them to review our two Canadian bank ETFs, including our recently launched Hamilton Enhanced Canadian Bank ETF (ticker: HCAL). This modestly levered fund offers greater potential return in a recovery, while paying a higher yield (~6.5%[7], paid monthly). HCAL may be particularly attractive to optimistic bank investors who currently have exposure to covered call products, which have experienced large and persistent underperformance for nearly a decade. HCAL also offers a higher yield versus covered call products, but without an options strategy set to cap returns in a recovery (covered call strategies experience their greatest underperformance in periods where the banks are recovering and/or experiencing upward volatility).
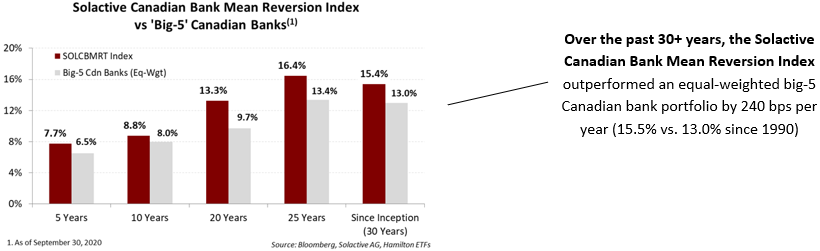
For investors who prefer unlevered exposure, we encourage them to review the Hamilton Canadian Bank Mean Reversion Index ETF (ticker: HCA), which has a yield of ~5.1%[8], also paid monthly. HCA seeks to replicate, before expenses, the Solactive Canadian Bank Mean Reversion Index, which outperformed an equal-weighted portfolio of the ‘big-5’ Canadian banks over the past 5, 10, 15, 20, 25 and 30 years (see chart below).
Related Insights
Hamilton Enhanced Canadian Bank ETF (HCAL) – Get More from the Canadian Banks (October 14, 2020)
Australian Banks: Entering the Recovery Stage of Credit Cycle (in 6 Charts) (August 28, 2020)
Australian Banks: Outperformance vs Canada (akin to Canadian Bank #4) (July 8, 2020)
Hamilton ETFs Launches Hamilton Financials Innovation ETF (June 1, 2020)
Canadian Banks: Three Vulnerable Loan Exposures (in Charts) (May 15, 2020)
Notes
[1] Please visit https://hamiltonetfs.com/etf/hca/ for more details.
[2] Provisions for credit losses rose from pre-cycle ‘normal’ of ~$3 bln to ~$11 bln and ~$7 bln in Q2 and Q3, respectively. Therefore, instead of booking $6 bln of loan losses in the past two quarters, the banks reported ~$18 bln. Source: Barclays, Hamilton ETFs.
[3] In the quarter preceding the credit cycle (i.e., fQ1), the Canadian banks generated ‘core’ earnings of ~$12 bln per quarter (i.e., Q1. Earnings in Q2 and Q3 were ~$5.7 bln and ~$9.7 bln, respectively). Source: Barclays, Hamilton ETFs
[4] Gross impaired loans rose from ~$16 bln in Q1 to $20 bln in Q3 (total loans excluding residential mortgages of over $1.8 trillion). Source: Barclays, Hamilton ETFs.
[5] As of fQ3, the banks had set aside total allowances for credit losses of ~$31.4 bln, including ~$23.5 bln set aside against loans that are still performing (also known as stage #1 and stage #2). Source: Barclays, Hamilton ETFs
[6] Total return, as measured by the S&P/TSX Composite Diversified Bank Index.
[7] As of October 22, 2020 the dividend yield was 6.49%.
[8] As of October 22, 2020 the dividend yield was 5.05%.
A word on trading liquidity for ETFs …
Hamilton ETFs are highly liquid ETFs that can be purchased and sold easily. ETFs are as liquid as their underlying holdings and the underlying holdings trade millions of shares each day.
How does that work? When ETF investors are buying (or selling) in the market, they may transact with another ETF investor or a market maker for the ETF. At all times, even if daily volume appears low, there is a market maker – typically a large bank-owned investment dealer – willing to fill the other side of the ETF order (at net asset value plus a spread). The market maker then subscribes to create or redeem units in the ETF from the ETF manager (e.g., Hamilton ETFs), who purchases or sells the underlying holdings for the ETF.