

In this insight, we share 6 charts that, in our view, indicate that the Australian banking sector – one of the world’s strongest – has entered the recovery stage of the credit cycle, which should be supportive of share prices.
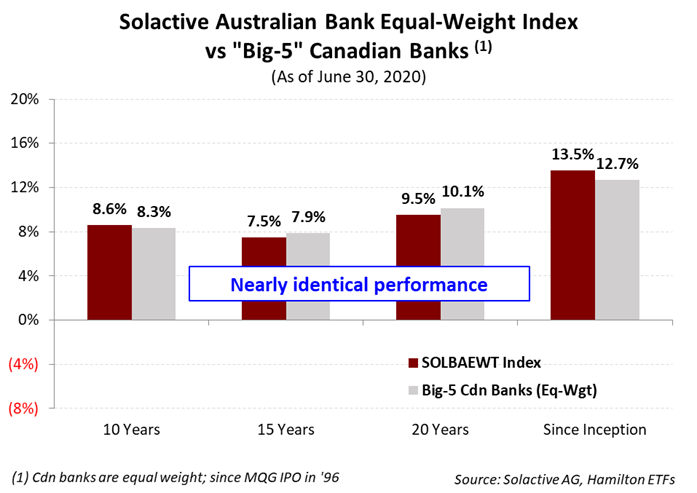
In the past, we have described the Canadian and Australian banking sectors as being akin to fraternal twins given their significant similarities, as well as those of their home countries[1]. In our view, these similarities are the main reason that the performance of these two great banking sectors has been nearly identical over the past 25 years. In our July 8th insight “Australian Banks: Outperformance vs Canada (akin to Canadian Bank #4)” we quantified the relative performance of the Solactive Australian Equal-Weight Bank Index (which our Hamilton Australian Bank Equal-Weight Index ETF, ticker HBA, seeks to replicate) versus an equal weight portfolio of Canadian banks over multiple periods (shown in the chart below), and explained some of the key similarities/differences between the two sectors.
We believe the credit recovery has likely begun for most major countries, including Australia, which should support rising profitability across the global financial sector. This severe downturn began abruptly, with the COVID-19 virus-induced economic shutdowns, causing both the Canadian and Australian bank stocks to decline ~40% peak-to-trough (and more for the European and U.S. banks). Since then, the Canadian banks have been a global outlier, recovering most of the decline and outperforming all other global banks by a substantial margin. In fact, the Canadian banks are now only down less than 10% year-to-date. The Australian banks have performed well versus global peers now down less than 20% year-to-date, while the U.S. and European banks are still down ~30% and 35%, respectively[2]. Interestingly, the Canadian banks experienced the best performance despite entering this credit cycle with capital ratios near the bottom globally and incurring some of the highest increases in loan losses.
We believe Australian banks are now entering the earnings recovery stage of the cycle, which over the next 18 months should be supportive of earnings, dividends, and stock prices. In fact, we would identify the following catalysts as supportive of our prediction:
- improving economic data from Australia, which has been one of the most successful developed economies globally in the past several decades.
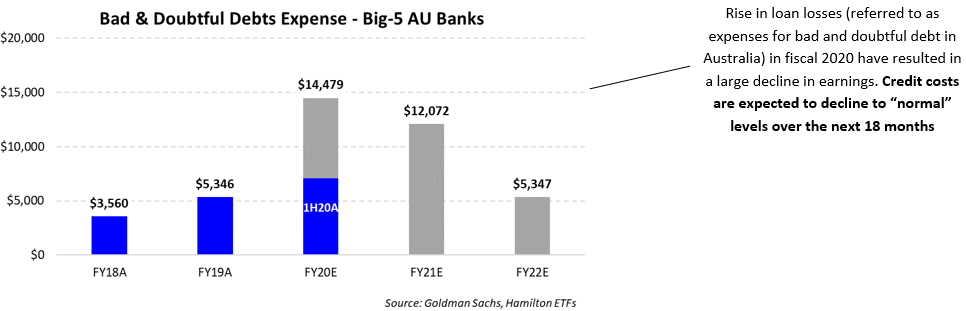
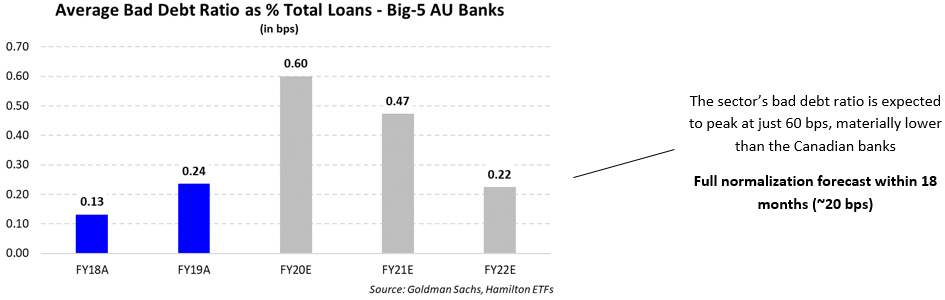
- a consensus forecast material decline in loan losses, and
- strong fiscal support from the federal government should the economy require additional stimulus (especially with Australia entering the downturn with debt-to-GDP at less than half of Canada).
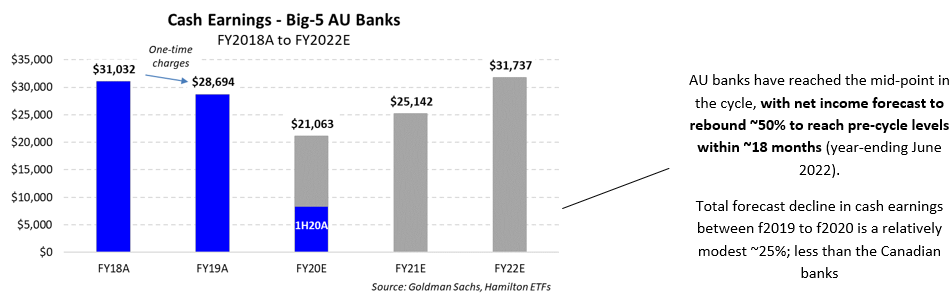
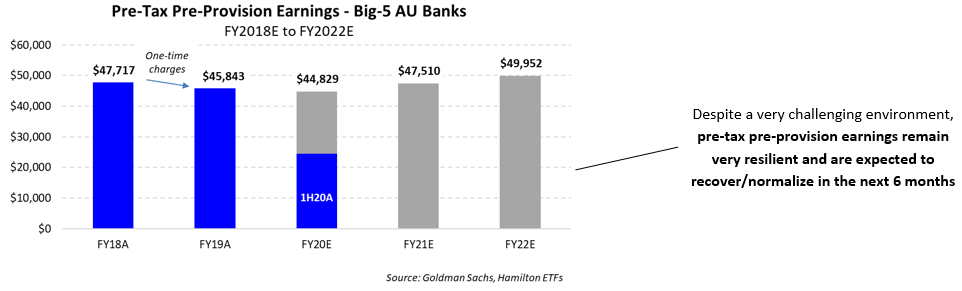
Below we include 6 charts that show the impact of the credit cycle and the expected pace of recovery (using Goldman Sachs forecasts) following the most recent reporting (quarterly/semi-annual, depending on the bank). Together, these charts highlight, in our view, the recovery anticipated in the next 18 months (ending June 30, 2022).
Note to Reader: Unlike the Canadian banks, the Australian banks have different reporting periods[3]. The charts below reflect the totals for the fiscal periods indicated, which substantially overlap, but are not completely aligned. Ratios represent an average of the Big-5 Australian banks. Actual results are indicated in blue, while grey represent forecasts from Goldman Sachs.
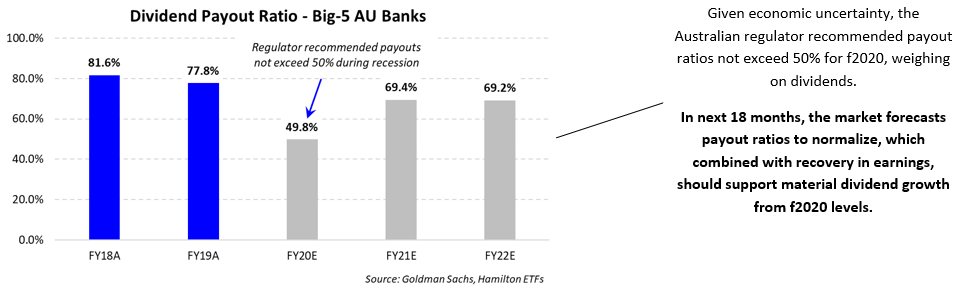
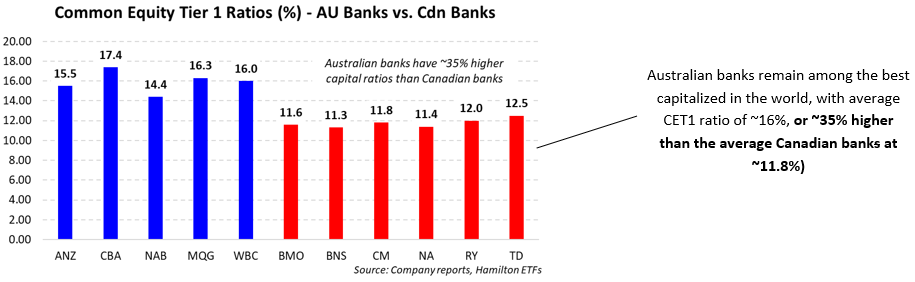
Despite entering this credit cycle with the world’s highest capital ratios – and 35% higher than the Canadian banks – the Australian banks were instructed to limit their payout ratios to 50% of earnings by the regulator (APRA), which took a very cautious approach to the downturn. However, as earnings recover in the latter half of calendar 2020 and into 2021, we anticipate dividends should begin to normalize.
As noted above, the Australian banks have outperformed the Canadian banks since Macquarie went public in the late 1990’s. In our view, the looming recovery in earnings and dividends form a favourable backdrop for the Hamilton Australian Bank Equal-Weight Index ETF (HBA). Given the similarities of the long-term return/volatility profile of the two sectors, we believe HBA is an attractive complement to domestic investors seeking “Canadian bank-like” exposure, but with added diversification benefits.
Notes
[1] See “Fraternal Twins – Australian and Canadian Financials” (September 6, 2019)
[2] As of August 27, 2020. Indices referenced are: KBW Bank Index (U.S. banks), Stoxx Europe 600 Banks Index (European banks), Solactive Canadian Bank Mean Reversion Index (Canadian banks), and Solactive Australian Banks Equal-Weight Index (Australian banks).
[3] NAB, WBC and ANZ have September year-ends, while CBA and MQG have June and March year-ends, respectively. The banks report full results on a semi-annual basis, and less detailed trading updates quarterly.
Related Insights:
Hamilton Global Financials ETF (HFG): Merging Two Global ETFs with Material Outperformance (June 26, 2020)
Canadian Banks: Outperformance from Mean Reversion (in 7 Charts) (June 11, 2020)
Hamilton ETFs Launches Hamilton Financials Innovation ETF (June 1, 2020)
Canadian Banks: Three Vulnerable Loan Categories in Charts (May 15, 2020)
One Chart: Australia Appears to be Flattening the Curve Ahead of Other Countries (April 2, 2020)
Financials: Does COVID-19 Represent a Growth Scare, Credit Event or Crisis? (March 25, 2020)
Update: HFA Outperforming the Canadian Banks with Lower Volatility (in Charts) (February 7, 2020)
One Chart: When/Where the Canadian Banks Spent US$32 bln on U.S. Banks (January 24, 2020)
One Chart: U.S. Bank M&A Doubles in 2019 (and Why We Expect More) (January 24, 2020)
A word on trading liquidity for ETFs …
Hamilton ETFs are highly liquid ETFs that can be purchased and sold easily. ETFs are as liquid as their underlying holdings and the underlying holdings trade millions of shares each day.
How does that work? When ETF investors are buying (or selling) in the market, they may transact with another ETF investor or a market maker for the ETF. At all times, even if daily volume appears low, there is a market maker – typically a large bank-owned investment dealer – willing to fill the other side of the ETF order (at net asset value plus a spread). The market maker then subscribes to create or redeem units in the ETF from the ETF manager (e.g., Hamilton ETFs), who purchases or sells the underlying holdings for the ETF.