

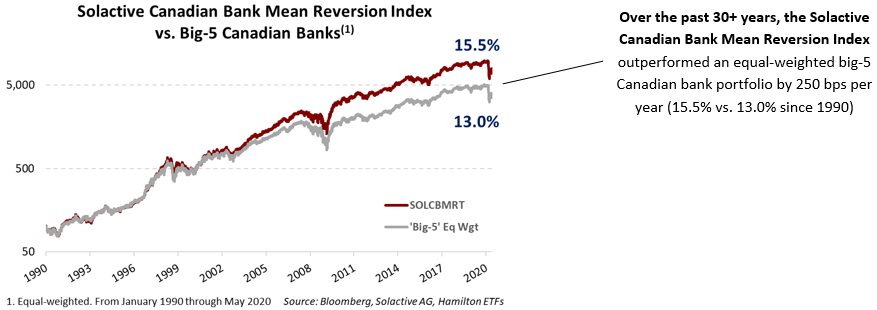
As all Canadian investors know, the stock prices of the Canadian banks are highly correlated, and the individual banks have generated similar returns over long periods of time. Over the past several decades, the Canadian banks that have underperformed tended to catch up to those that outperformed, and vice versa – i.e., their performance was “mean reverting”. In this Insight, we discuss these mean reversion tendencies and show – in 7 charts – why it remains such a powerful and successful theme in Canadian bank investing.
Given the steep correction of the Canadian banks since mid-February from COVID-19 and the resultant credit cycle, we believe investment opportunities for mean reversion are rising. An environment like the one markets are currently experiencing – characterized by high(er) volatility with an upside (recovery) trend – has historically been most favourable for mean reversion strategies. It is also the least favourable backdrop for Canadian bank portfolios using covered call strategies, which charge higher fees and tend to underperform in periods of rising markets and recovering valuations (as options are a drag on returns). We would note, year-to-date as of June 10th, HCB, which employs a mean reversion strategy, is the top performing Canadian bank ETF in Canada, while those with covered calls strategies – despite a steep correction – have generated the lowest returns[1].
A look back at mean reversion trends for the Canadian banks
When you consider the extremely high historical correlations – and mean reversion tendencies – of Canadian bank stock prices, the reasons are apparent. The individual banks have very similar: (i) business mixes, (ii) geographic footprints, (iii) capital strength, (iv) dividend policy, and (v) they share the same regulator.
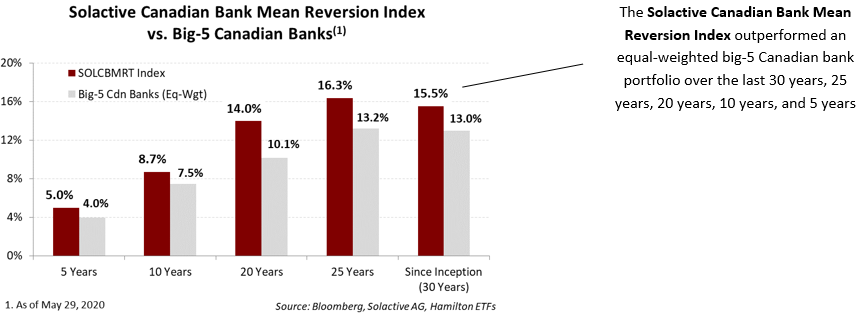
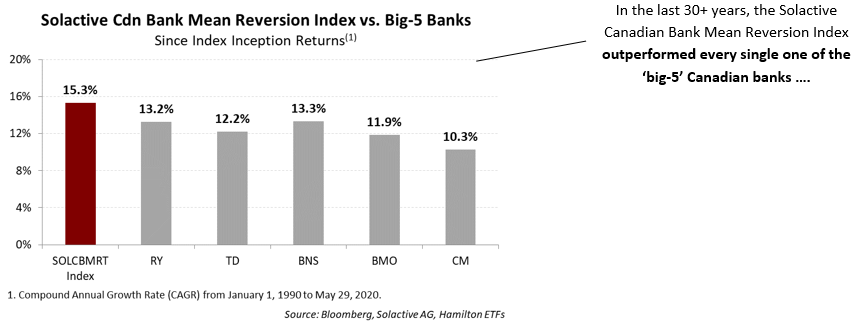
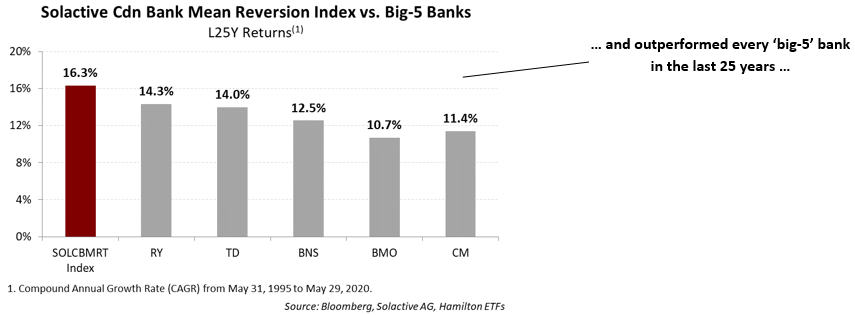
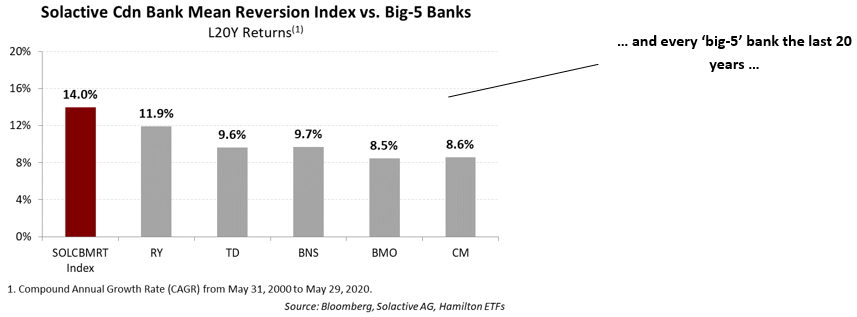
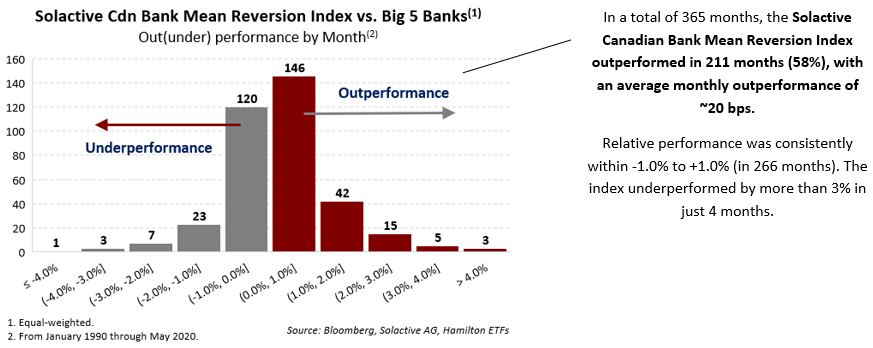
How significant has the outperformance for mean reversion strategies been in the last 30 years? Below, we show 7 charts encompassing 30 years of total returns of the Solactive Canadian Bank Mean Reversion Index TR (SOLCBMRT) versus individual and a portfolio of the big-5 Canadian banks[2]. These 7 charts quantify the: (i) consistent outperformance over multi-decade time periods, (ii) consistent outperformance during periods of market turbulence/cycles, and (iii) frequency and magnitude of average monthly outperformance.
The Hamilton Canadian Bank Variable-Weight ETF (ticker: HCB) is our current mean reversion strategy, offering investors automatic access to this powerful investment theme. On June 29th, HCB will merge with the Hamilton Canadian Bank Mean Reversion Index ETF (ticker: HCA)[3], which will seek to replicate the SOLCBMRT Index, providing efficient exposure to this strategy at very low (institutional) transaction costs, automatic monthly rebalancing and a lower management fee (0.45%).
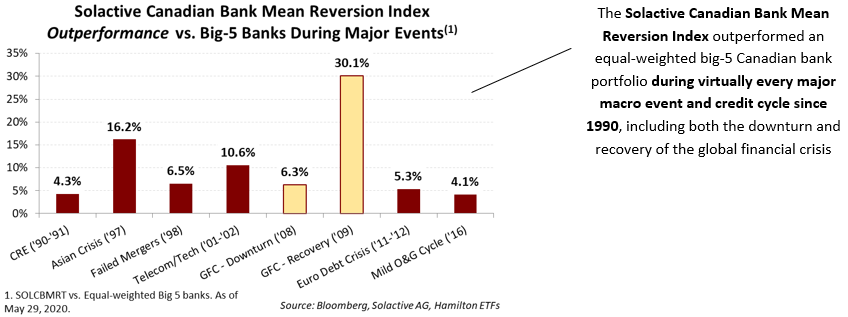
As noted above, over the past thirty years, the benefits of mean reversion have been greatest during periods where the sector experienced higher volatility especially within the group. Given the Canadian banks are in the early stages of a credit cycle and their valuations are depressed, we believe the opportunity from mean reversion is rising, especially relative to covered call strategies. To the extent this credit cycle results in a divergence in performance between the Canadian banks, it could form a favourable backdrop for our mean reversion strategy, the Hamilton Canadian Bank Mean Reversion Index ETF (ticker HCA).
Notes
[1] Source: Bloomberg. Year-to-date as of June 10, 2020.
[2] Equal-weighted, rebalanced monthly.
[3] The merger is subject to unitholder approval. Please visit www.hamiltonetfs.com for the associated press release, management information circular and ETF Facts, which provide more information on the proposed merger.
Related Insights:
Canadian Banks: Three Vulnerable Loan Categories in Charts (May 15, 2020)
One Chart: Australia Appears to be Flattening the Curve Ahead of Other Countries (April 2, 2020)
Financials: Does COVID-19 Represent a Growth Scare, Credit Event or Crisis? (March 25, 2020)
Update: HFA Outperforming the Canadian Banks with Lower Volatility (in Charts) (February 7, 2020)
One Chart: When/Where the Canadian Banks Spent US$32 bln on U.S. Banks (January 24, 2020)
One Chart: U.S. Bank M&A Doubles in 2019 (and Why We Expect More) (January 24, 2020)
A word on trading liquidity for ETFs …
Hamilton ETFs are highly liquid ETFs that can be purchased and sold easily. ETFs are as liquid as their underlying holdings and the underlying holdings trade millions of shares each day.
How does that work? When ETF investors are buying (or selling) in the market, they may transact with another ETF investor or a market maker for the ETF. At all times, even if daily volume appears low, there is a market maker – typically a large bank-owned investment dealer – willing to fill the other side of the ETF order (at net asset value plus a spread). The market maker then subscribes to create or redeem units in the ETF from the ETF manager (e.g., Hamilton ETFs), who purchases or sells the underlying holdings for the ETF.