

The recovery of the Australian economy and banks is accelerating. In this insight, we discuss how the Australian banking sector – one of the world’s strongest – has firmly entered the recovery stage of the credit cycle and what that means for share prices.
In the past, we have described the Canadian and Australian banking sectors as being akin to fraternal twins given their significant similarities, as well as those of their home countries. Because the Canadian banks are highly correlated to one another, there is statistically no diversification (or risk) benefit to investors from adding a fourth Canadian bank to a three-bank portfolio. However, the Australian banks have much lower correlations to their Canadian peers, despite having a very similar return/volatility profile. As a result, we recommend that Canadian investors consider the Hamilton Australian Bank Equal-Weight Index ETF (HBA), as a substitute for Canadian bank position #4. Historically, a portfolio with both Canadian and Australian banks has produced a higher return with lower volatility than a portfolio composed exclusively of either country.
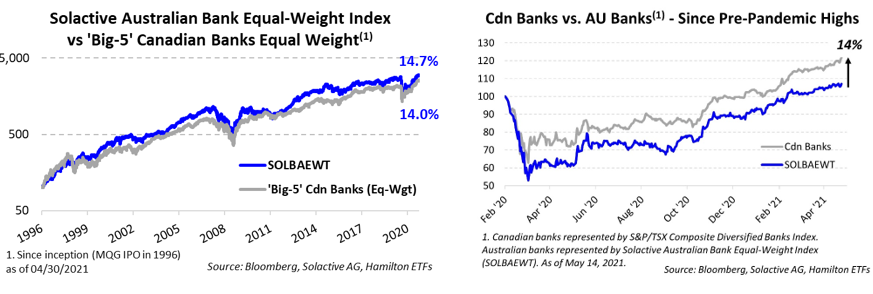
As the charts below highlight, the Australian banks have outperformed the Canadian banks over the last 25 years (chart, left), and the last ten years. However, despite Australia having one of the best pandemic responses globally and its banks experiencing a comparatively milder credit cycle, Australian bank stocks have lagged their Canadian peers in the recovery (chart, right), with the latter having benefited from a powerful and rapid recovery in investor sentiment. This has created an opportune time for Canadian bank investors to add Australian banks to their portfolios.
Given their long-term history of converging performance, the Australian banks could outperform the Canadian banks by as much as 10% in the next two years. In fact, we believe the Australian banks currently represent one of the most favourable risk/rewards in global banks, supported by three catalysts:
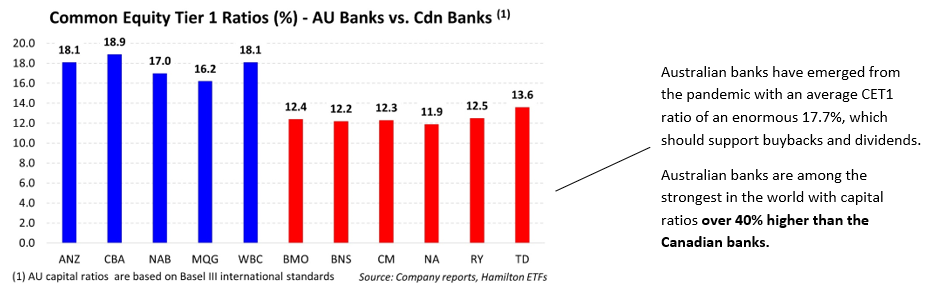
First, significant capital return, in the form of dividends and large buybacks, would support both EPS growth and ROEs. Capital levels are so high for the Australian banks that Goldman Sachs estimates that the big-4 banks have excess capital between 7-10% of their market capitalization that could support substantial buybacks, and possibly even special dividends. We also believe dividend yields could rise to over 7% within the next 18 months, which while high, would be lower than pre-pandemic levels. (See below for a chart of Australian vs Canadian bank capital ratios)
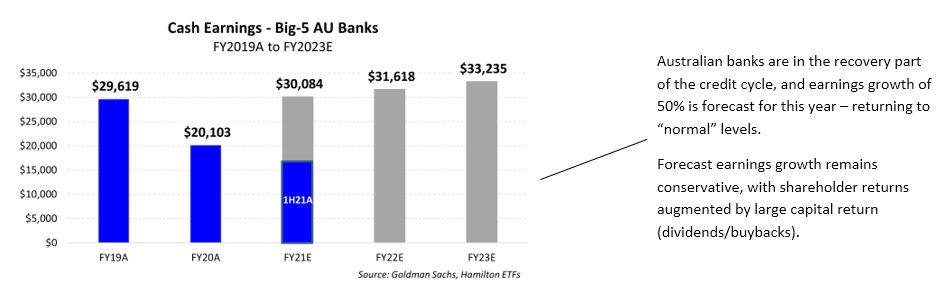
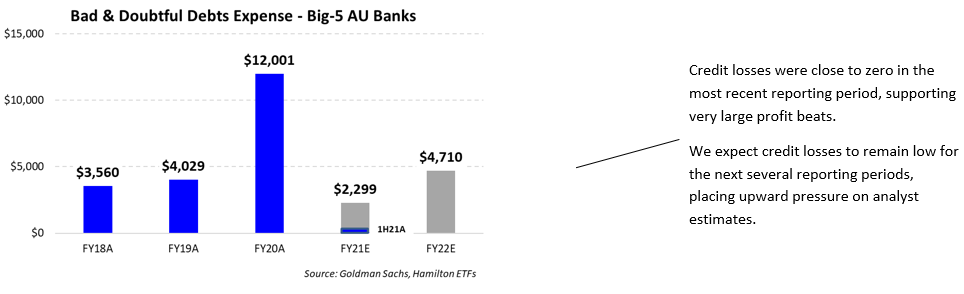
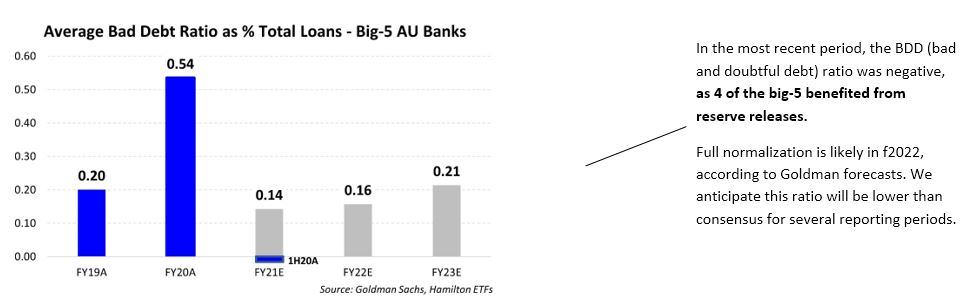
Second, the ongoing earnings recovery supported by falling loan losses and expense management. Goldman Sachs forecasts earnings growth this year of ~50%, aided by falling loan losses and strong operating leverage. In fact, four Australian banks reported reserve releases in their most recent earnings, and we believe those releases could increase in the coming reporting periods. Moreover, the steepening of the yield curve holds the potential for rising net interest margins. Given the Australian banks have a higher percentage of personal and commercial P&C banking than the Canadian banks, their leverage to rising rates is greater than that of the Canadian banks. (See below for a chart of Australian bank net income)
Third, declining macro risk relative to other countries. Australia’s fiscal and monetary position entering the pandemic compared favourably to its global peers, including Canada, U.S., and Europe. For example, Australia’s 2019 debt-to-GDP was 48% versus ~87% for Canada and 108% for the U.S[1]. And unlike Canada and the U.S., the country was forecasting a budget surplus in 2020 before the pandemic hit. Like other countries, Australia is injecting substantial fiscal stimulus, but we believe their path to fiscal sustainability is far less daunting than for both the U.S. and Canada.
Below, we include 5 charts that show the impact of the credit cycle and the expected pace of recovery (using Goldman Sachs forecasts) following the most recent reporting (quarterly/semi-annual, depending on the bank).
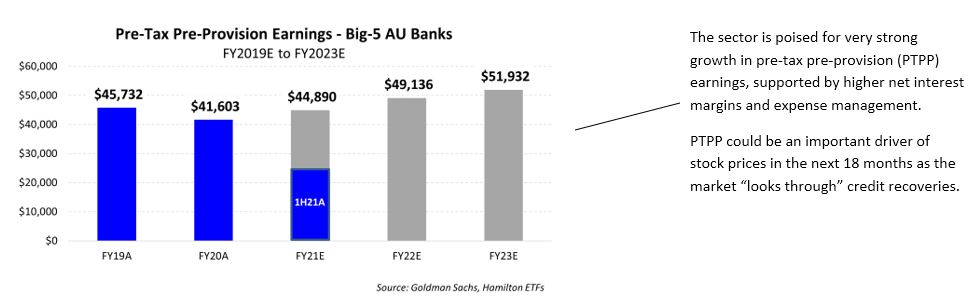
Note to reader: Unlike the Canadian banks, the Australian banks have different reporting periods[2]. The charts below reflect the totals for the fiscal periods indicated, which substantially overlap, but are not completely aligned. Ratios represent an average of the Big-5 Australian banks. Actual results are indicated in blue, while grey represent Goldman Sachs forecasts.
As noted above, an equal weight portfolio of Australian banks has outperformed an equal weight portfolio of Canadian banks in the last 25 years (i.e., since Macquarie went public in the late 1990’s). In our view, the ongoing powerful recovery in earnings and dividends forms a favourable backdrop for the Hamilton Australian Bank Equal-Weight Index ETF (HBA). Given the similarities of the long-term return/volatility profile of the two sectors, we believe HBA is an attractive complement to domestic investors seeking “Canadian bank-like” exposure, but with added diversification benefits.
Recent Notes:
Australian Banks: Entering Recovery Stage of Credit Cycle (in 6 Charts) (August 28, 2020)
Australian Banks: Outperformance vs Canada (akin to Canadian Bank #4) (July 8, 2020)
Hamilton ETFs Announces Proposed Merger of Hamilton Australian Financials Yield ETF into Hamilton Australian Bank Equal-Weight Index ETF (April 28, 2020)
Canadian Banks: Outperformance from Mean Reversion (in 7 Charts) (June 11, 2020)
Canadian Banks: Three Vulnerable Loan Categories in Charts (May 15, 2020)
One Chart: Australia Appears to be Flattening the Curve Ahead of Other Countries (April 2, 2020)
Financials: Does COVID-19 Represent a Growth Scare, Credit Event or Crisis? (March 25, 2020)
____
A word on trading liquidity for ETFs …
Hamilton ETFs are highly liquid ETFs that can be purchased and sold easily. ETFs are as liquid as their underlying holdings and the underlying holdings trade millions of shares each day.
How does that work? When ETF investors are buying (or selling) in the market, they may transact with another ETF investor or a market maker for the ETF. At all times, even if daily volume appears low, there is a market maker – typically a large bank-owned investment dealer – willing to fill the other side of the ETF order (at net asset value plus a spread). The market maker then subscribes to create or redeem units in the ETF from the ETF manager (e.g., Hamilton ETFs), who purchases or sells the underlying holdings for the ETF.
Notes
[1] Source: IMF; represents general government gross debt as a % of GDP
[2] NAB, WBC and ANZ have September year-ends, while CBA and MQG have June and March year-ends, respectively. The banks report full results on a semi-annual basis, and less detailed trading updates quarterly.