Even with the strong November, Canadian bank stocks are down ~15% peak-to-trough, reflecting the market’s concern of a possible global recession caused by central banks aggressively raising interest rates with the goal of taming inflation. At the same time, central bankers are also engaging in the relatively new policy of quantitative tightening (the effect of which cannot be quantified).
The decline in Canadian bank share prices can be attributed almost entirely to falling price-to-earnings (“P/E”) multiples. Relative to pre-COVID P/E valuations, we estimate the market is forecasting a 10%-15% decline in consensus estimates and, by inference, a large and sustained increase in loan losses. In this insight we discuss three key things to watch and why we believe consensus estimates declining by this much is a lower probability outcome.
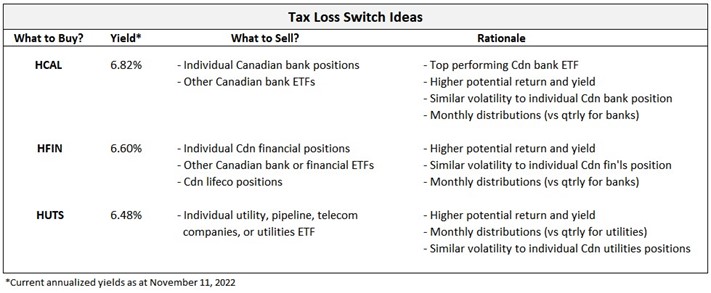
Before we discuss the banks, we would like to highlight three of our popular ‘enhanced’ ETFs for investors as potential tax loss switch ideas: (i) the Hamilton Enhanced Canadian Bank ETF (HCAL), the top performing Canadian bank ETF since its inception[1]; (ii) the Hamilton Enhanced Canadian Financials ETF (HFIN), which invests in the top 12 Canadian financials by market-cap; (iii) the Hamilton Enhanced Utilities ETF (HUTS), providing exposure to Canada’s 12 largest utility, pipeline, and telecom companies.

Now, back to the Canadian banks.
Depressed Valuations Suggest Market is Pricing in 10%-15% Cut to EPS Estimates – Three Things to Watch in fQ4
Despite the recent bounce, the Canadian banks still trade at a very depressed ~9.5x current (f2023) and ~9.1x forward (f2024)[2] consensus estimates. Thus far, analyst estimates do not reflect this bearish sentiment; consensus estimates have not declined very much since the correction began. In a slow growth environment, where the banks are generating modest low-single-digit EPS growth, mid-teen ROEs, and dividend yields of 4.0%+, we believe the sector would trade at least ~10x earnings – which would be slightly lower than the average over the last 20 years.
Therefore, either the banks suffer from a second downturn, loan losses spike, and consensus estimates fall, or the bank stocks rally on multiple expansion should these bearish credit expectations not arise. In our view, there are three key things that will determine the outcome. Two of which represent hurdles to downward revisions – the third is a wildcard.
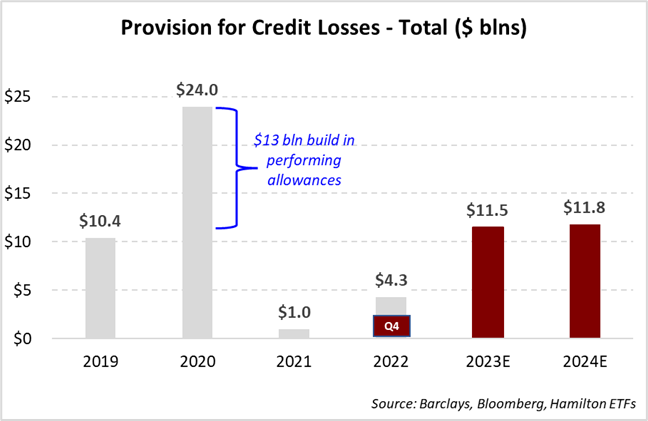
First, we believe analyst estimates for impaired loan losses are already conservative. The sell-side is currently forecasting a substantial increase in total provisions starting with next quarter (fQ4). Looking forward, as the chart highlights, f2023 total provisions for credit losses (PCLs) are forecast to more than double versus 2022 to $11.5 bln (and remain stable in 2024).

Even more important, we estimate consensus provisions for credit losses (PCLs) on impaired loans are forecast to rise 60% to $8.8 bln in 2023, and another 14% in 2024 (to $10 bln). Therefore, for consensus to decline by 10%-15%, loan losses would have to rise significantly above $11.5 bln. It is worth noting that despite the large sell-off in Canadian banks after reporting Q3, two key indicators of potential credit deterioration – trends in gross impaired loans and provisions against performing loans, actually improved (i.e., declined).
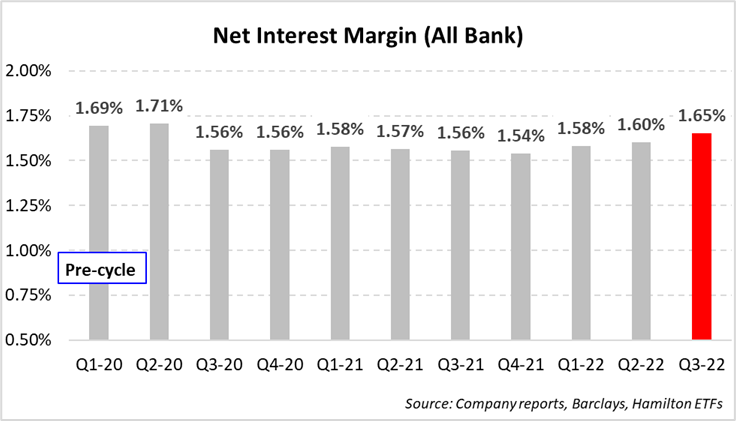
Second, NIMs are poised to rise further, which will support revenue growth. It is true that the large and rapid increase in central bank rates and borrowing costs could weigh on loan volume growth and possibly result in higher loan losses. However, rising interest rates also have a large potential positive – expanding net interest margins (NIMs). Should NIMs rise, this would support growth in net interest income, which is the largest source of bank revenues. The chart below shows all-bank NIMs rose by a material 5 bps last quarter.

With interest rates higher than pre-COVID, we would expect all-bank NIMs to rise above pre-cycle levels – perhaps materially. It is also worth noting that in the past 20 years, all-bank NIMs have been 50-75 bps higher than current levels, suggesting substantial potential upside in the coming years. Either way, rising NIMs would support revenue growth, and at least partially offset the impact of higher loan losses, should they occur.
The Wildcard? Changes in (Already) Large Performing Allowances
Conservative analyst estimates for loan losses and the prospect of rising NIMs both represent important obstacles to 10%-15% downward revisions to consensus EPS estimates. However, there is one potential wild-card, which could either add or detract from short-term earnings – the accounting for performing allowances. This reserve accounting is relatively new and represents amounts set aside for potential losses against loans that are “fine” (i.e., current in interest and principal). In reference to the volatility to earnings from this reserve accounting, Jamie Dimon recently noted, “we spend a lot of time on these [earnings] calls describing something that is virtually irrelevant to the bank”.
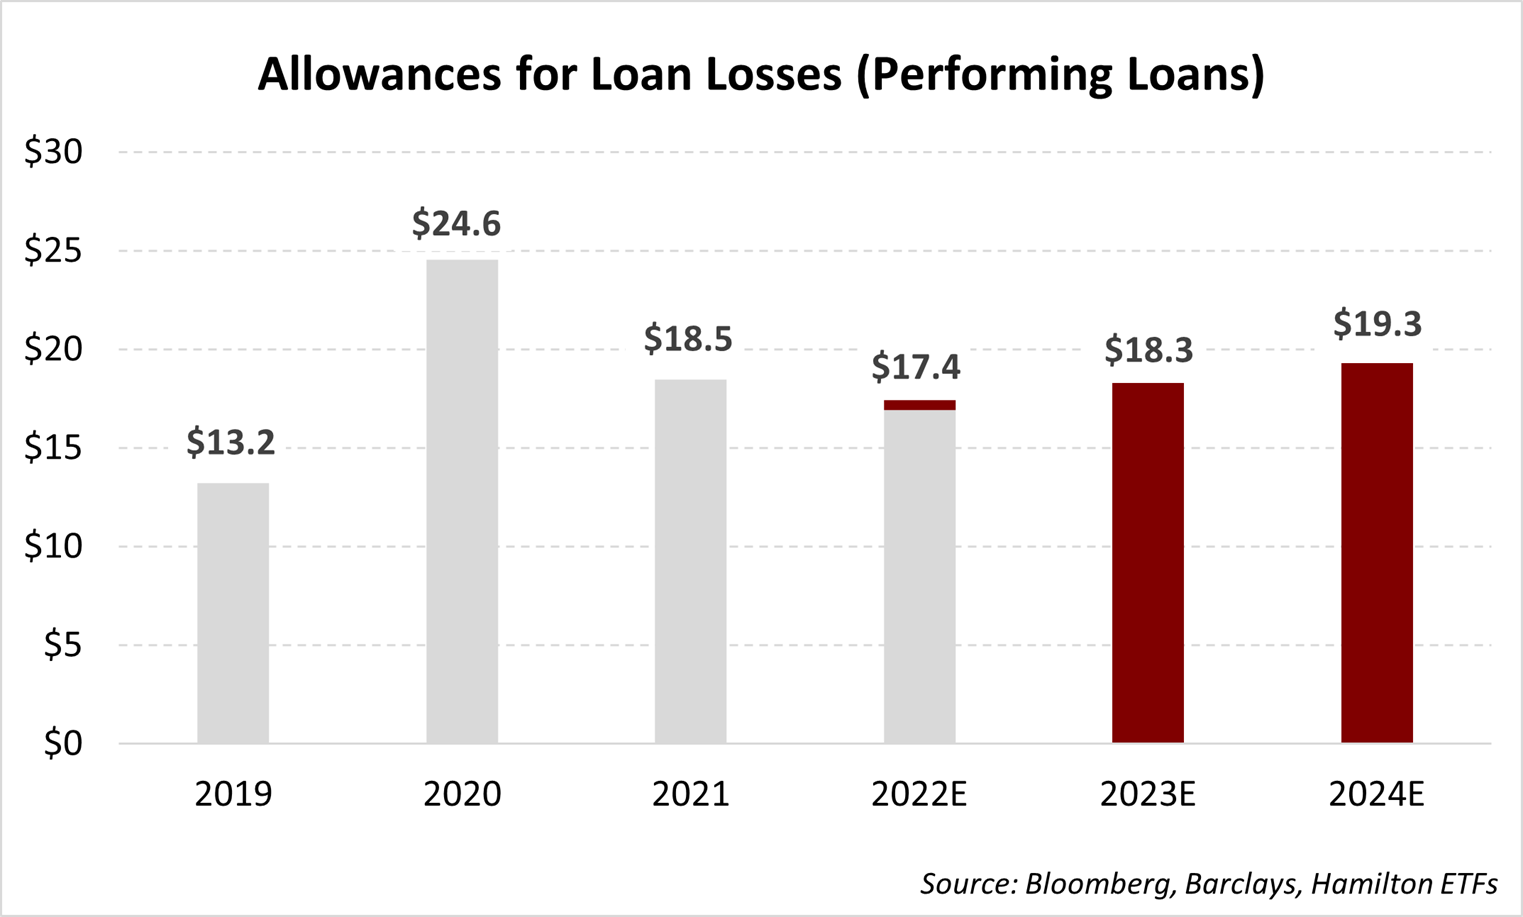
For the Canadian banks, this accounting is no less consequential to reported earnings. Provisions for performing loans has been – BY FAR – the biggest driver of earnings changes since COVID. Early in the downturn, the banks built this reserve in three quarters by ~$12 bln (weighing on earnings), and then followed it with six quarters of releases, totalling $7.5 bln (adding to earnings). The current performing allowance is large at over $17 bln with analysts conservatively forecasting it to rise in the next two years to over $19 bln (see chart).

However, if the economy turns down sharply, the banks could conceivably build this “non-cash” reserve over and above analyst forecasts. If the economy remains stable, it is likely this reserve does not change materially. Regardless, even though this is an accounting reserve, it can – and does – create significant volatility to earnings, especially in the short-term.
It Will Take a LOT of Bad News to Validate Today’s Discounted Valuations
Heading into fQ4 earnings season, we believe the market is pricing in a steep 10%-15% reduction in consensus EPS estimates for f2023 and f2024. As mentioned, we believe the three key things to watch this quarter are analyst estimates for impaired PCLs, the potential revenue lift from rising NIMs and the potential impact on accounting earnings from changes in performing allowances.
Even though quarterly earnings are near all-time highs, ROEs are in the mid-teens and balance sheets are very strong (high capital/reserves), it is reasonable to expect a slowdown in earnings growth from a slowing economy. And while it is possible consensus estimates decline, it would take a very sharp downturn for credit losses to rise above current analyst estimates. Importantly, unemployment – a key driver of provisions – remains low.
Given the Canadian banks are trading at discounted valuations, the market is reflecting many of these possible negative effects. We believe it will take no small amount of bad news to validate these bearish valuations, suggesting potential upside to Canadian bank stocks in the form of multiple expansion.
Investors seeking exposure to Canadian banks and insurers should consider the Hamilton Enhanced Canadian Financials ETF (HFIN), which offers the potential for higher long-term returns and a higher yield (6.60%[3], paid monthly). Investors seeking exposure to purely the Canadian banks should consider our top performing Canadian bank ETF[4], the Hamilton Enhanced Canadian Bank ETF (HCAL) or the Hamilton Canadian Bank Mean Reversion Index ETF (HCA), which offer attractive yields of 6.82% and 5.09%, respectively (paid monthly)[5].
Recent Insights & Events
Canadian Banks: Should Investors be (More) Worried? | September 6, 2022
Market Outlook with Ed Yardeni | October 17, 2022
Canadian Bank CEO Event with RBC & TD | June 9, 2022
Canadian Banks: TD Buys FHN – A Very Strong Fit | May 16, 2022
Canadian Banks: 2022 starts with M&A; Recovery Continues (fQ1 in Charts) | March 11, 2022
Canadian Banks: BMO’s High Risk, High(er) Reward Acquisition of BoW | January 27, 2022
HCA/HCAL Lead All Canadian Bank ETFs in 2021 | January 26, 2022
____
A word on trading liquidity for ETFs …
Hamilton ETFs are highly liquid ETFs that can be purchased and sold easily. ETFs are as liquid as their underlying holdings and the underlying holdings trade millions of shares each day.
How does that work? When ETF investors are buying (or selling) in the market, they may transact with another ETF investor or a market maker for the ETF. At all times, even if daily volume appears low, there is a market maker – typically a large bank-owned investment dealer – willing to fill the other side of the ETF order (at net asset value plus a spread). The market maker then subscribes to create or redeem units in the ETF from the ETF manager (e.g., Hamilton ETFs), who purchases or sells the underlying holdings for the ETF.
[1] Since inception on October 14, 2020, as at October 31, 2022. Based on universe of seven Canadian bank ETFs that trade on the Toronto Stock Exchange
[2] The average of the Big-6 Canadian banks, as of November 11, 2022. Source: Bloomberg.
[3] As of November 11, 2022.
[4] Since inception, as at October 31, 2022. Based on a universe of seven Canadian bank ETFs that trade on the Toronto Stock Exchange.
[5] As of November 11, 2022.

