

Bank of Montreal recently announced the acquisition of BNP Paribas’ U.S. retail banking subsidiary, Bank of the West (BoW) for ~C$20 bln – the largest acquisition in Canadian banking history. The transaction is very different from prior acquisitions made by the Canadian banks and is further complicated by the fact that BoW is not publicly traded (wholly owned by BNP), so most Canadian investors have limited knowledge of the platform. In this insight, we will focus on how these and other differences make this one of the high(er) risk, high(er) reward acquisitions by any Canadian bank – ever.
HFIN NOW TRADING/HYLD COMING SOON: We would like to announce the launch of the Hamilton Enhanced Canadian Financials ETF (HFIN), which beings trading today on the TSX. Structured similarly to HCAL (i.e. with modest leverage of 25%), our popular enhanced Canadian bank ETF, HFIN offers added diversification by investing in the top 12 largest Canadian financials by market capitalization. HFIN will have an initial target yield of 5% with monthly distributions. We also expect our second multi-sector ETF, the Hamilton Enhanced U.S. Covered Call ETF (HYLD, HYLD.U), to begin trading in early February. Like HDIV, our Canadian-focused covered call ETF, HYLD will offer a broad U.S. equity exposure via a diversified portfolio of covered call ETFs. In HYLD’s case, the sector mix will be broadly similar to that of the S&P 500 (vs. HDIV which aims for a sector mix similar to that of the TSX 60) and have a target yield of 9%. HYLD will be offered in both CAD hedged (HYLD) and USD unhedged (HYLD.U) units. See table below for information about both ETFs. 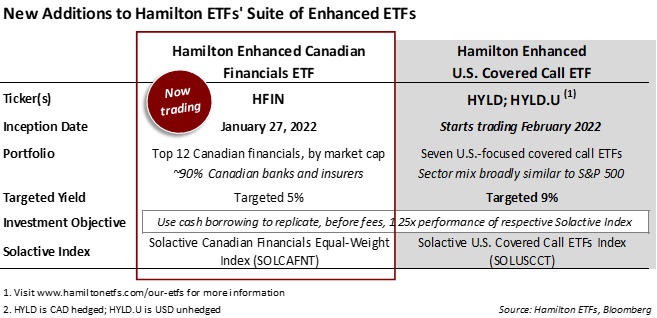
Back to BMO and BoW.
This acquisition of Bank of the West stands in stark contrast to other international acquisitions made by the Canadian banks in almost every major aspect. Below, we discuss six significant differences.
Note to Reader: Unless otherwise stated, amounts are stated in U.S. dollars and the source of market share and deposit information is S&P Global Market Intelligence. For simplicity, Metropolitan Statistical Areas (MSAs)[1] will be referred to by their anchor city. For example, the Chicago-Naperville-Elgin, IL-IN-WI MSA is referred to as Chicago MSA.
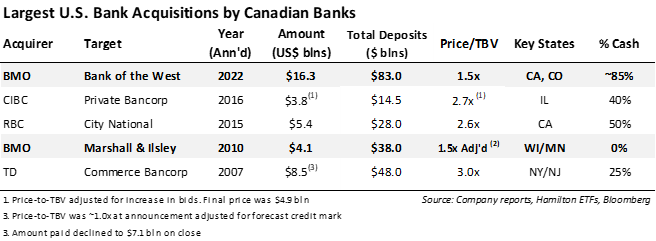
First, the most obvious difference is the size of the acquisition. BMO is paying $16.3 bln for BoW, the 24th largest bank in the U.S. as measured by deposits ($83 bln)[2], more than twice what any Canadian bank has ever spent on U.S. bank M&A. Previously the largest transaction was by TD, which offered $8.3 bln for New Jersey’s Commerce Bancorp in 2007 (deposits of $48 bln) in a deal that could not have had worse timing, closing on the eve of the financial crisis. The BoW deal is a very large transaction and will vault BMO to #11 in the United States by deposits (up from #20, but still behind TD at #8)[3]. Below is a chart comparing some of the largest U.S. bank deals made by Canadian banks in the last 15 years (ranked by year of announcement).
Second, the composition of financing – 85% cash/15% equity – is atypical especially given the huge size of the deal. There is no question the bank’s desire to maximize EPS accretions and minimize ROE dilution was a factor in its decision to include such a substantial cash component. BMO’s ability to fund 85% with cash is a function of: (i) the nearly two-year restriction of capital return by OSFI during COVID, which pushed BMO’s CET1 ratio to an all-time high of 13.7% and (ii) the long closing period of nearly a year, which will allow for internal capital generation by BMO over the next several quarters. The bank has stated it will maintain its 40-50% payout ratio and expects to have a CET1 ratio of over 11% after closing.
Third, the long closing period (expected to be 10-to-11-months) is long by historical standards. The transaction is expected to close “near the end of calendar 2022”[4]. Given the price to be paid is fixed (versus share for share at a ratio), this means that BMO assumes both deal risk (such as a macro event) and deal opportunity (should, for example, the yield curve steepen and/or shift upward driving NIMs higher). With the Fed poised for a major shift in monetary policy by tapering asset purchases and increasing rates, we believe this is an underappreciated and important aspect of the transaction.
Fourth, the strategic rationale is very different. BMO has prioritized scale over geography by acquiring a large bank with virtually no platform overlap. Not only is BoW not in the same states and MSAs as BMO, it is also – for the most part – not even in the same regions[5]. Most market participants – including us – expected BMO to acquire one of the many smaller mid-cap banks in the Midwest, to gain additional scale for its existing platform and have the greater opportunity for expense and revenue synergies. Instead, BMO opted for immediate scale buying a platform with ~90% of its deposits spread across the West (mostly California), and Southwest (mostly Colorado and New Mexico), far away from BMO’s home region of the Midwest (with ~80% of deposits in Chicago, Milwaukee, and Minneapolis MSAs).
One reason BMO was expected to acquire a mid-cap is that this segment of the U.S. banking sector has been – and continues to be – the epicenter of consolidation. This secular trend began over 30 years ago and is an important component of the investment thesis of our Hamilton U.S. Mid/Small Cap U.S. Financials ETF (HUM, HUM.U), which was among the top 10 performing ETFs in Canada and the top performing financials ETF (U.S. or domestic) in 2021 according to Morningstar. HUM owns over 30 U.S. mid-cap banks that by virtue of their size, higher growth geographies, and franchise quality are expected to participate in the ongoing consolidation of the U.S. banking sector.
Fifth, BMO forecasts large expense synergies despite limited overlap. Historically, the very crude rule of thumb for expense synergies in U.S. bank M&A is between 20% and 40% of the target’s expenses, ranging from zero to near-total platform overlap. For the BoW transaction, BMO has assumed 35% of target, despite the fact only 4% of deposits are in overlapping MSAs5. Applying the traditional “rule” would imply forecast synergies of closer to 20% of target. That said, the banking sector’s significant increase in technology and regulatory spend over the last two decades has shifted more expenses to head offices (versus branches), making this historical rule of thumb less applicable.
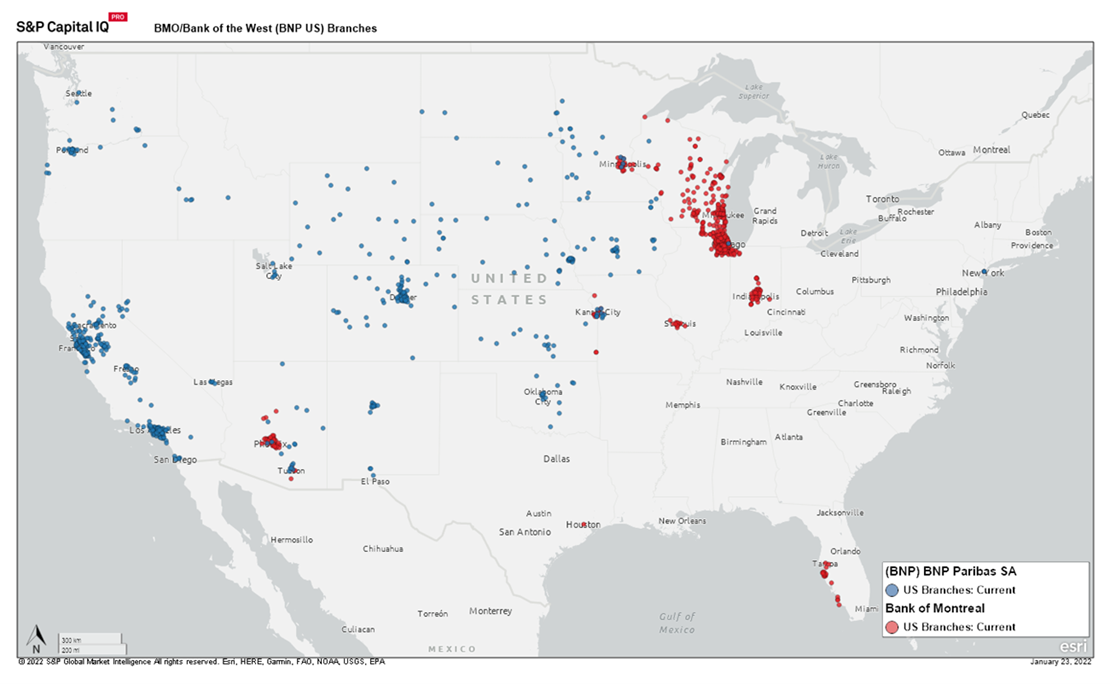
Moreover, BoW’s sprawling platform should allow for meaningful cost savings through branch rationalization. For example, although both platforms have just over 500 branches, BMO has ~60% higher (~$50 bln) deposits. BMO has a top 5 market position in 8 of its top 10 MSAs, which account for over 90% of its deposits. By contrast, BoW has 40% of its deposits in 4 MSAs where it has a top 5 market position, most notably San Francisco MSA where it is #5[6]. BoW has a sizeable ~18% of its branches (and 10% of deposits) in MSAs where it does not have a top 10 market position. In fact, BOW operates in a whopping 107 MSAs, including over 50 where it has a single branch. For comparison, BMO operates in 44 MSAs, despite being much larger. This should create significant opportunity for BMO to close, merge and/or divest a large number of branches to increase efficiencies. In our view, BoW’s lack of market concentration (as illustrated by the map below) is a key factor underpinning BMO’s high forecast cost synergies.
Sixth, the size and lower ROE/ROA of BoW make execution risk higher for BMO. We believe BoW’s sub-par operating metrics are a function of its sprawling platform. It is not a “plug and play” acquisition and will require substantial effort to get the platform to peer average operating metrics. This is almost the opposite of Marshall & Ilsley (M&I), which BMO acquired in 2011. Although M&I’s asset quality was struggling under the weight of the financial crisis, BMO acquired a high-quality deposit franchise with strong (top-5) market positions in strategically valuable and proximate Midwest MSAs at a very low price.
What does this all mean for BMO?
It is clear BMO is breaking new ground and testing prior market and financing conventions. The market’s relatively muted reaction to the deal is highly significant. It is very common for banks announcing much smaller acquisitions to experience sharp selloffs including relative multiple compression and underperformance as the market prices in unknown execution risk. This has not been the case for BMO/BoW. Impressively, since the acquisition was rumoured on December 16, 2021, BMO has underperformed the Canadian bank index by only ~200 bps[7].
The bank has attempted to mitigate deal risk in several important ways, which we believe has contributed to the market’s relatively positive reception. First, the bank took a substantial credit mark and expects to report a very large restructuring charge – both of which offer potential for higher than forecast accretions, if conservative[8]. Second, by funding ~85% of the proceeds with cash, BMO has limited the ROE dilution and virtually guaranteed EPS accretions, since it only needs to out-earn cash. Finally, the most important factor favouring BMO is time. Management has almost a year to plan for integration, and 3-5 years to execute. In the meantime, the market is demonstrating a clear sign of its confidence in management for a transaction that offers potential for high reward.
Bank of Montreal is a 10.7% weighting in the Hamilton Enhanced Canadian Financials ETF (HFIN), which holds over 90% Canadian banks and insurers. Our Hamilton Enhanced Canadian Bank ETF (HCAL) and Hamilton Canadian Bank Mean Reversion Index ETF (HCA), which were the top performing Canadian bank ETFs in 2021, have indirect and direct exposure to BMO, respectively. We also own BMO in our Hamilton Global Financials ETF (HFG), which outperformed the S&P Global Financials Index (SGFS) by ~400 bps in 2021.
Recent Insights
HCA/HCAL Lead All Canadian Bank ETFs in 2021 | January 6, 2022
Canadian Banks: Five Possible Drivers in 2022 (Q4 2021 in Charts) | December 17, 2021
U.S. Banks: M&A Features Prominently on Q1 Calls | April 30, 2021
U.S. Banks: The Return of M&A – A Clear Sign of Bankers’ Conviction in the Recovery | December 16, 2020
One Chart: U.S. Bank M&A Doubles in 2019 (and Why We Expect More) | January 24, 2020
____
A word on trading liquidity for ETFs …
Hamilton ETFs are highly liquid ETFs that can be purchased and sold easily. ETFs are as liquid as their underlying holdings and the underlying holdings trade millions of shares each day.
How does that work? When ETF investors are buying (or selling) in the market, they may transact with another ETF investor or a market maker for the ETF. At all times, even if daily volume appears low, there is a market maker – typically a large bank-owned investment dealer – willing to fill the other side of the ETF order (at the bid/ask spread).
[1] Per Census.gov, MSAs “consist of the county or counties (or equivalent entities) associated with at least one urbanized area of at least 50,000 population, plus adjacent counties having a high degree of social and economic integration with the core as measured through commuting ties.”
[2] Excluding excess capital, BMO estimates the purchase price to be ~$13.4 bln assuming a CET1 ratio for BoW of 11%.
[3] As of 2021. Source: S&P Global Market Intelligence. This ranking drops to #10 if sweep deposits from online brokerage are excluded.
[4] Closing periods have generally been closer to 6 months. That said, they have been longer since COVID, although this is only partly attributable to the pandemic. Larger bank M&A deals have been getting increasing scrutiny since last year’s change in administration. In BoW’s case, the timeline may also have been driven by BMO desire for more time to build capital.
[5] Approximately 4% of BoW deposits are in MSAs common to BMO: Minneapolis, Kansas City, Phoenix, and Tuscon. BoW has less than 10% of its deposits in several Midwest states that are furthest away from where BMO operates, including: Nebraska, Iowa, Kansas, North Dakota and South Dakota.
[6] The other top 10 MSAs were BoW has a top 5 market share are Albuquerque, Modesto, and Fresno.
[7] As of January 24, 2022
[8] BMO is taking a gross credit mark of C$992 mln, or 126 basis points and a fair value mark to equity of C$218 mln – both accreted into earnings. BMO also anticipates pre-tax merger and integration costs of Cdn$1.7 bln.